POLI 7000 Writing Assignment 4
POLI 7000 Writing Assignment 4
Soren Jordan
Spring 2021
This will be due April 28 (Wednesday) by 11:59 PM to Canvas as a .pdf. You lose 10 points for each day it is late. A complete assignment consists of three parts:
1. First, the actual written document (position paper). You must produce the required document in a professional way. The required document is outlined in the section “Written Assignment.”
2. Second, the general questions and R script. You will be asked a series of questions about the statistics behind the written document (position paper). These questions are outlined in the section “R Instructions and Questions.”
(a) Answer these as comments in your R script.
(b) Then, to demonstrate your proficiency with the software, you must turn in the code you executed to obtain the results you use to construct the written document (position paper).
3. Third, once all of the questions are answered, please run your R script to execute it in the R console. Copy and paste the R console at the end.
Thus, when turning in the assignment, you should have the written document (position paper) first. Then, you should start a new page and paste the script, followed by the console, and save the whole thing as a .pdf. This is still a writing assignment. That means your sentences should be free of spelling and grammatical errors and should use complete sentences. You should also follow the guidelines for creating attractive documents, as outlined separately on Canvas.
Recall: you are allowed to consult with one another on coding for homework assignments, as long as
1. You never “divide and conquer” the assignment. All students are responsible for all portions of each assignment, and
2. You are not allowed to collaborate on the “applied” or “discussion” portions of ques-tions. You can code together, but as soon as you start writing sentences, you must use your own words and your own words alone, and3. You explain your answers. Even if an answer is a simple mathematical solution, explain how you arrived at it. I can’t give partial credit for wrong numbers, but I can give partial credit for a thought process.
If you have questions . . .
• Overall, please feel free to post to the relevant Discussion page on Canvas.
• About R, please feel free to email me directly.
• About style, please free to email Noemi ([email protected]), our TA.
The assignment starts on the next page.
R Instructions and Questions
Reminder: to download data and read it into R
1. Download the dataset (usually XXX.csv) from Canvas
2. Move it to wherever all of your course materials are on your computer
3. Once it is on your computer, copy the filepath and read it into R
• On a Mac, you can use option + command + c to copy a file path
• On Windows, hold down shift and right-click to Copy as path. See tinyurl.com/windows-file-path. Also, on Windows you must reverse the direction of the slashes in the filepath
• As a reminder, there are scripts on Canvas to use as a helpful example
Read Jefferson, Neuner, and Pasek, “Seeing Blue in Black and White: Race and Perceptions of Officer-Involved Shootings.”
Download the data from Canvas: jnp.csv.1 It contains eight variables:
• X: A counter variable for each row
• education: The respondent’s education
– 1 = Less than high school
– 2 = High school degree
– 3 = Some college
– 4 = College degree
– 5 = Post-college degree
• age: The age of the respondent
– (Age in years)
• suburban: An indicator (dummy) variable for if the respondent is from a suburb
– 0 = No (urban or rural)
– 1 = Yes (suburban)
• income: The respondent’s income
– 1 = Less than $25,000
– 2 = $25,000 to $49,999
– 3 = $50,000 to $74,999
– 4 = $75,000 to $99,999
– 5 = $100,000 to $149,999
– 6 = $150,000 or more
• female: An indicator (dummy) variable for if the respondent is female
– 0 = No
– 1 = Yes
• white: An indicator (dummy) variable for if the respondent self-identifies as white2
– 0 = No (any other race)
– 1 = Yes (white)
• black: An indicator (dummy) variable for if the respondent self-identifies as Black3
– 0 = No (any other race)
– 1 = Yes (Black)
• ideology: The ideology of the respondent
– 1 = Extremely conservative
– 2 = Conservative
– 3 = Slightly conservative
– 4 = Moderate
– 5 = Slightly liberal
– 6 = Liberal
– 7 = Extremely liberal
• party: The party identification of the respondent
– 1 = Strong Republican
– 2 = Republican
– 3 = Independent, closer to Republican
– 4 = Independent
– 5 = Independent, closer to Democrat
– 6 = Democrat
– 7 = Strong Democrat
• efficacy: The belief of the respondent that people (like them) can affect what government does
– 1 = Not at all
– 2 = A little
– 3 = A moderate amount
– 4 = A lot
– 5 = A great deal
• forceonwhite: How often does the respondent believe police use more force than is necessary under the circumstances when dealing with white people
– 1 = Never
– 2 = Rarely
– 3 = Sometimes
– 4 = Usually
– 5 = Always
• forceonblack: How often does the respondent believe police use more force than is necessary under the circumstances when dealing with Black people
– 1 = Never
– 2 = Rarely
– 3 = Sometimes
– 4 = Usually
– 5 = Always
• crimfair: How fair does the respondent believe the criminal justice system is in how it treats people
– 1 = Not at all fair
– 2 = Slightly fair
– 3 = Somewhat fair
– 4 = Very fair
– 5 = Completely fair
• policetreat: Does the respondent believe police treat whites better than Blacks, treat Blacks better than whites, or treat them both the same?
– 1 = Police treat Blacks much better
– 2 = Police treat Blacks moderately better
– 3 = Police treat Blacks a little better
– 4 = Police treat both the same
– 5 = Police treat whites a little better
– 6 = Police treat whites moderately better
– 7 = Police treat whites much better
• nameofficer: An indicator (dummy) variable for if the respondent knew the name of the officer that shot Michael Brown
– 0 = No (chose one of three incorrect names from a list of four names)
– 1 = Yes (chose correct name from a list of four names)
• officerindicted: An indicator (dummy) variable for if the respondent correctly knew whether the officer was indicted
– 0 = No (incorrect believed the officer was indicted)
– 1 = Yes (correctly believed the officer was not indicted)
• hadweapon: Did the respondent know whether Michael Brown had a weapon
– 1 = Respondent believed that Michael Brown definitely had a weapon (incorrect)
– 2 = Respondent believed that Michael Brown probably had a weapon (incorrect)
– 3 = Respondent believed that Michael Brown probably did not have a weapon (correct)
– 4 = Respondent believed that Michael Brown definitely did not have a weapon (correct)
• hadcrime: Did the respondent know whether Michael Brown had committed a crime before the incident
– 1 = Respondent believed that Michael Brown definitely had not committed a crime (incorrect)
– 2 = Respondent believed that Michael Brown probably had not committed a crime (incorrect)
– 3 = Respondent believed that Michael Brown probably had committed a crime (correct)
– 4 = Respondent believed that Michael Brown definitely had committed a crime (correct)
• invested: The emotional investment of the respondent in the events of Ferguson, Missouri
– 1 = Not at all
– 2 = A little
– 3 = A moderate amount
– 4 = A lot
– 5 = A great deal
• racerole: The belief the respondent has that race played a role in the events of Ferguson, Missouri
– 1 = Not role at all
– 2 = A little role
– 3 = A moderate role
– 4 = A large role
– 5 = An enormous role
Use the following instructions. For this assignment, you should answer all of the questions in your R script. (You will use your answers to create the written product.)
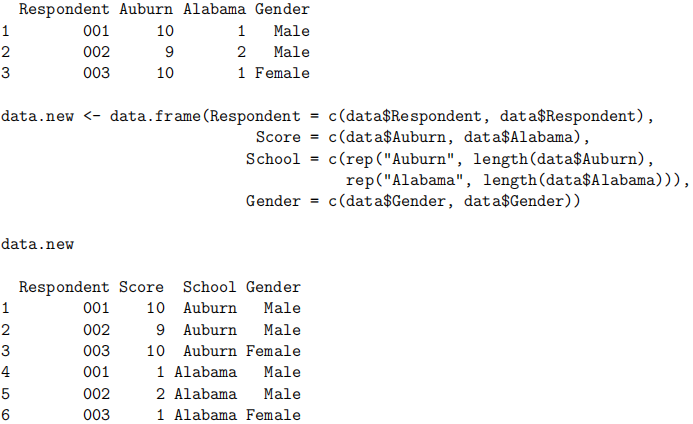
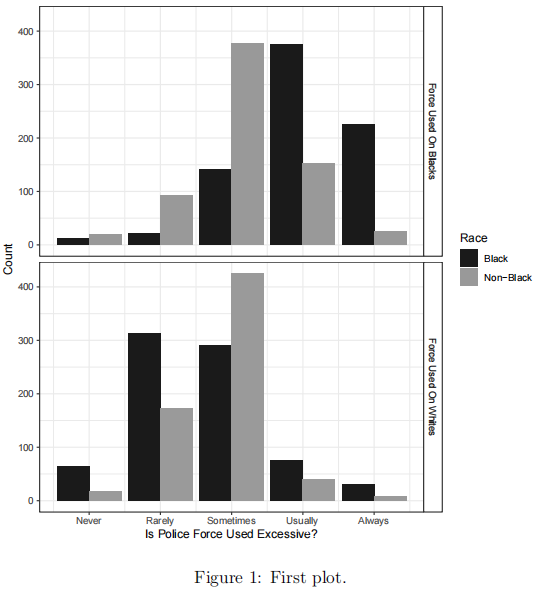
1. First, investigate general perceptions of the criminal justice system and use of police force. Using ggplot, create a barplot of the beliefs of whether the use of force is excessive, faceted by whether the use of force is against whites or against Blacks, and filled by whether the respondent is Black or non-Black. (This figure is shown in Figure2. This time, you must match the colors, axis labels, and control the labels of the x-axis to represent the category labels rather than the numbers.) Hint: if you want to facet by a question, you might need to transform the dataset so that one column is all of the responses and the other is the question type. For instance:4
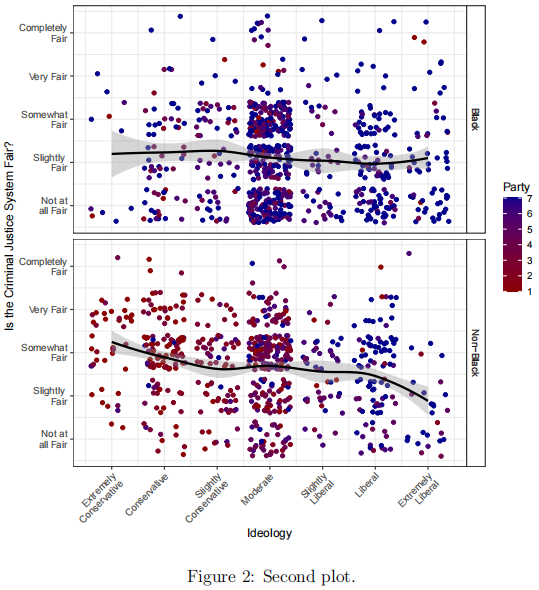
2. Using ggplot, create a jittered plot with a smoothed regression line, showing the relationship between ideology and whether the criminal justice system is fair. The points should be colored by party, and the panels should be faceted by whether the respondent is Black or non-Black. (This figure is shown in Figure 2. This time, the colors must be changed so that Republicans are the traditional red and Democrats are the traditional blue. The labels must also show the category labels rather than the numbers.)
3. Investigate the appropriate bivariate test of the relationship between policetreat and party.
(a) Justify your choice of bivariate test.
(b) Interpret the statistical significance of the test.
(c) Interpret the substantive significance of the test.
4. Investigate the appropriate bivariate test of the relationship between white and forceonwhite and white and forceonblack. For each,
(a) Justify your choice of bivariate test.
(b) Interpret the statistical significance of the test.
(c) Interpret the substantive significance of the test.
5. Estimate the regression of forceonblack (Y) on black, suburban, and female. Then, estimate the regression of forceonwhite (Y) on black, suburban, and female. For each regression,
(a) Interpret the
from each regression. Why is it useful here? What kind of respondent does it represent?
(b) Interpret the R2 from each regression.
(c) Interpret the RMSE from each regression.
6. Estimate four more regressions. The four dependent variables (Y) are forceonblack, forceonwhite, crimfair, and policetreat. In each regression, the independent variables (X) are black, party, ideology, suburban, female, income, education, and age. For each regression,
(a) Interpret the
(b) Interpret the
from each regression.
(c) Interpret the RMSE from each regression.
(d) Interpret the statistical significance of each X variable in each of the regressions.
(e) Interpret the
on black in each regression.
(f) Interpret the effect of shifting from “conservative” to “liberal” on ideology in each regression.
(g) Interpret the effect of 25-unit increase in age in each regression.
(h) Generate a prediction (
) for a non-Black, Independent, moderate, suburban, male, with average income, average education, and average age in each regression.
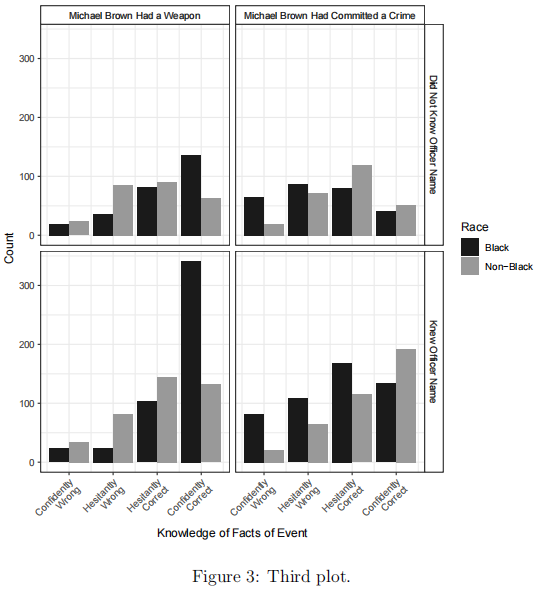
7. Next, investigate perceptions of the Michael Brown shooting in Ferguson. Using ggplot, create a barplot of whether the respondent had the correct knowledge about whether Michael Brown had committed a crime or had a weapon. Facet (in rows) based on whether the respondent knew the name of the officer. Facet (in columns) based on whether the question is about the commission of a crime or whether he had a weapon. Fill by whether the respondent is Black or non-Black. (This figure is shown in Figure 3. This time, you must match the colors, axis labels, and control the labels of the x-axis to represent the category labels rather than the numbers.)
8. Estimate two regressions. The two dependent variables (Y ) are hadweapon and hadcrime. In each regression, the independent variables (X) are black, party, ideology, suburban, female, nameofficer, officerindicted, income, education, and age. For each regression,
(a) Interpret the
(b) Interpret the
(c) Interpret the RMSE from each regression.
(d) Interpret the statistical significance of each X variable in each of the regressions.
(e) Interpret the
(f) Interpret the maximum effect of party in each regression.
(g) Interpret the maximum effect of ideology in each regression.
(h) Interpret the
(i) In each regression, which variable is the most substantively significant? Justify your answer.
(j) What does it mean for the sign on party to flip across the regressions?
9. Finally, investigate how these perceptions inform the respondent’s investment with the process. Estimate two last regressions. The two dependent variables (Y ) are invested and racerole. In each regression, the independent variables (X) are black, party, ideology, suburban, female, hadweapon, hadcrime, income, education, and age. For each regression,
(a) Interpret the
from each regression. Is it substantively useful?
(b) Interpret the
from each regression.
(c) Interpret the RMSE from each regression.
(d) Interpret the statistical significance of each X variable in each of the regressions.
(e) Interpret the
on black in each regression.
(f) Interpret the maximum effect of party in each regression.
(g) Interpret the maximum effect of ideology in each regression.
(h) Interpret the maximum effect of hadweapon in each regression.
(i) Interpret the maximum effect of hadcrime in each regression.
(j) Generate twelve predictions. For each regression:
i. A non-Black, conservative, Republican, suburban, male, with average income, high school education, and average age, who is confidently wrong that Michael Brown had weapon, and confidently wrong that Michael Brown had not committed a crime.
ii. A non-Black, conservative, Republican, suburban, male, with average income, high school education, and average age, who is confidently correct that Michael Brown did not have weapon, and confidently correct that Michael Brown had committed a crime.
iii. A non-Black, moderate, Independent, suburban, male, with average income, high school education, and average age, who is confidently wrong that Michael Brown had weapon, and confidently wrong that Michael Brown had not committed a crime.
iv. A non-Black, moderate, Independent, suburban, male, with average income, high school education, and average age, who is confidently correct that Michael Brown did not have weapon, and confidently correct that Michael Brown had committed a crime.
v. A non-Black, liberal, Democrat, suburban, male, with average income, high school education, and average age, who is confidently wrong that Michael Brown had weapon, and confidently wrong that Michael Brown had not committed a crime.
vi. A non-Black, liberal, Democrat, suburban, male, with average income, high school education, and average age, who is confidently correct that Michael Brown did not have weapon, and confidently correct that Michael Brown had committed a crime.
10. Look across all of the regressions. Which dependent variable Y do we explain best? Justify your answer.
11. Where does party have the biggest effect, accounting for the scale of Y ?
Written Assignment
You are an employee at a nonpartisan, nonprofit interest group fighting for fairness in citizen interactions with police. As a research associate, you find the given dataset on perceptions of police interactions in Ferguson, Missouri. You show the data to your director, and the director tells you to work with your writing partner to develop a position paper using the data.
You must write a position paper. On Canvas, there are many, many examples of position papers. Specifically for the assignment, your position paper must argue for specific interventions to improve citizen fairness in police interactions. It is intended to be distributed, so it should be geared towards non-statistics audiences. Your writing partner will take care of writing the early sections; you’re responsible for the “Opinion” section.
Note: this is also meant to practice using analysis to communicate with non-analysts. As you discuss your models, you should do so in plain English. Specifically:
• Avoid phrases like “effect of X on Y ,” instead focusing on the actual variables.
• Where possible, replace the discussion of “units” of variables with the actual unit (for instance, if the variable is age, talk about a one-year increase in age, not a one-unit increase in age).
• Use consistent, non-obnoxious rounding (like to the tenths place).
• At no point should your document include R code.
• Cite any research in a footnote.
• In all other places, follow the position paper style guide on Canvas.
Opinion
• Begin by showing the first plot: Figure 1. Use the plot to address:
– Is there consensus about whether police force is used excessively against whites?
– Is there consensus about whether police force is used excessively against Blacks?
– Are there systematic differences between the perceptions of Black and non-Black people on these two questions?
• Show the second plot: Figure 2. Use the plot to address:
– What is the pattern of the perceptions of Black individuals of the fairness of the criminal justice system and their ideology? Does the relationship seem to depend on ideology? Does the relationship seem to depend on partisanship? Interpret the smoothed line in particular.
– What is the pattern of the perceptions of non-Black individuals of the fairness of the criminal justice system and their ideology? Does the relationship seem to depend on ideology? Does the relationship seem to depend on partisanship? Justify your interpretations.
• Broadly introduce the four regressions you ran in #6, using plain English (for instance “we attempted to explain [the dependent variable] with [the independent variables]”).
– Describe your ability to explain each of the four dependent variables, referencing a measure of model fit.
– Identify any predictors that are statistically significant in all of the models. Discuss what this means in plain English.
– Interpret the effect of these predictors, potentially using things you calculated in the R script.
• Show the third plot: Figure 3. Use the plot to address:
– Is there any pattern to the perceptions of whether Michael Brown had a weapon or had committed a crime for individuals who did not know the officer’s name?
– Is there any pattern to the perceptions of whether Michael Brown had a weapon or had committed a crime for individuals who did know the officer’s name?
– What are Black individuals most likely to be correct about? What are Black individuals most likely to be incorrect about?
– What are non-Black individuals most likely to be correct about? What are non-Black individuals most likely to be incorrect about?
• Broadly introduce the two regressions you ran in #8, using plain English (for instance “we attempted to explain [the dependent variable] with [the independent variables]”).
– Describe your ability to explain each of the two dependent variables, referencing a measure of model fit.
– Identify any predictors that are statistically significant in both of the models. Discuss what this means in plain English.
– Interpret the effect of these predictors, potentially using things you calculated in the R script.
2021-04-17