COMP 9517 T1, 2021 Assignment 1: Specification
COMP 9517
T1, 2021
Assignment 1: Specification
|
The assignment files should be submitted online. Deadline for submission is Week 5 Monday 15 March 2021, 08:59:59 AEDT Instructions for submission will be posted closer to the deadline. |
Maximum marks achievable: 10 marks
This assignment is worth 10% of the total course marks
Blood testing is a common medical examination in hospitals. In pathology labs, different types of blood cells are counted to determine a patient’s disease. Red blood cell (RBC) counts can help detectseveral ailments such as anemia, malaria, leukemia, etc. RBC counts that are above or below the normal level can be a sign of disease and determine if an individual needs medical assistance. In this assignment, you will explore the use of image processing techniques to count the number of RBCs in an image.
Objectives: The assignment is aimed at familiarisation with basic image processing methods. It also introduces you to common image processing and analysis tasks using OpenCV.
Learning Outcomes: After completing this assignment, you will learn how to:
1. Open and read image files
2. Perform simple mathematical operations on images
3. Implement two thresholding techniques
4. Perform segmentation by choosing the thresholding technique
5. Count the number of cells in an image using connected components
Deliverables: You will submit a report (maximum 5 pages) briefly explaining the approach you have taken in Tasks 1 and 2 and display some sample input images and the intermediate and final images obtained. You must also submit the Jupyter notebook file.
Submission: The assignment files should be submitted online via WebCMS. Instructions for submission will be posted closer to the deadline.
Tip: You are advised to use OpenCV 3+ with python 3+.
Task 1: Otsu and HSV Thresholding (5 marks)
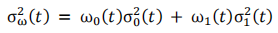
In computer vision, Otsu’s method is used to automatically perform image thresholding. It assumes that the image pixels can be separated into two classes, foreground and background, using a singly intensity threshold. This threshold is determined by minimising intra-class variance, defined as a weighted sum of variances of the two classes:
where  and
and  are the probabilities of the two classes separated by a threshold t and
  and
and  are variances of these two classes.
The algorithm is explained below:
1. Compute histogram and probabilities of each intensity pixel
2. Setup initial  (0) and
  (0)
(0)
3. Step through all possible thresholds t=1,...maximum intensity
a. Update

b. Compute
(t)
(t)
There are other thresholding techniques that generally perform better than Otsu’s method especially in filtering coloured parts of an image. Unlike the Otsu’s method, HSV colour space can be used to filter based on the pixel colours, but also by brightness and colour intensity.
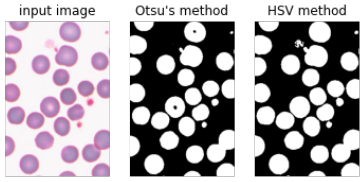
In this task, implement two thresholding techniques - Otsu’s thresholding method and use the HSV colour space on the images provided - to find a good threshold value for each image. Then generate a binary image with the background encoded as black [pixel value: 0] and the cell as white [pixel value: 255].
● Input: image
● Output: input image, Otsu binary image, HSV binary image and threshold values
NOTE: Do not forget to include the threshold values for both methods.
Task 2: Counting the number of cells (5 marks)
In this task, you are required to count the number of cells in each image by counting the number of connected components in the image.
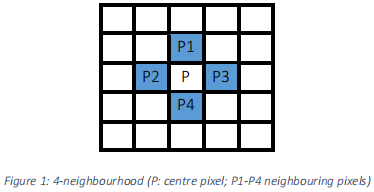
As a pre-processing step, noisy pixels in the binary image generated in Task 1 should first be removed. Apply a median filter to the thresholded binary image produced in Task 1, to remove any noisy pixels. Then, using the two-pass connected components algorithm (explained below), iterate through the binary image. During the first pass temporary labels are assigned to each data point and the equivalences are stored, and during the second pass the temporary labels are replaced by the smallest label from its equivalence class. Use the connected component labels assigned in the second pass to isolate the cell in the original image, and then count the number of cell. Consider two pixels to be adjacent if they share the same colour / intensity and each belongs to the other’s four-neighbourhood, as illustrated below:
Implement the two-pass connected component labelling algorithm as described below:
First pass:
Iterate through each pixel in the image matrix:
If the pixel is not the background:
Second pass:
Get the neighbouring elements of the current pixel
If there are no neighbours:
uniquely label the current pixel and continue
else:
find the neighbour with the smallest label and assign
the same label to the current pixel
Store the equivalence between neighbouring labels
Iterate through each pixel of the data by column, then by row If the pixel is not in the background:
Relabel the element with the lowest equivalent label
(Source : https://en.wikipedia.org/wiki/Connected-component_labeling)
It is important to note that there may be overlapping cells in the images (such is the case in a real lab setting). However, images in this task were carefully chosen to ensure that there are at most 2 overlapping cells. Otherwise, this task would have been more complicated and techniques other than connected-components might be needed.
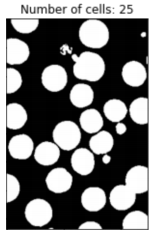
With this assumption, individual cells occupy a minimum area (‘min_area’) and overlapping cells occupy a larger area (‘overlap_area’) in comparison to individual cells. Determine a minimum area ‘min_area’ and ‘overlap_area’ and use the connected component labels generated in Task 2 to the number of total cells in the image.
(The total number of cells is the number of labels with min_area < pixel area < overlap_area, plus the number of overlapping cells which is twice the labels with pixel_area > overlap_area)
• Input:
o binary image generated in Task 1,
o ‘min_area’ (choose an appropriate value that would separate cells from other parts (i.e. noise) of the image
o ‘overlap_area’ (choose an appropriate value that would separate overlapping cells from individual cells)
• Output:
o filtered binary image, number of cells in the image
ORGANIZING THE CODE
The assignment code should be submitted as a Jupyter notebook named Assignment1.ipynb. Each task should be written as separate functions within this file and should be able to run in separate cells. The input details should be passed to the functions. The input image should be readable from the location specified as an argument, and all output images should be displayed in the notebook environment. In addition to an image, an output value is generated during each task, and this value should be written as a title while saving the.
Sample images and outline python code can be downloaded from the course website. The code should be organized as shown below (| | stands for folder):
| code |
Assignment1.ipynb
|
DO NOT use library function from OpenCV (or any other packages) such as threshold adaptiveThreshold watershed findContours contourArea drawContours connectedComponents medianBlur SimpleBlobDetector or similar ones. |
© Copyright: Arcot Sowmya, CSE, UNSW, with acknowledgements to COMP 9517 teaching team past and present.
2021-03-14
The assignment is aimed at familiarisation with basic image processing methods.