BST811 BUSINESS DATA ANALYTICS
BST811 BUSINESS DATA ANALYTICS
Academic Year 2020-2021
COURSEWORK
This assessment is of TWO PARTS and accounts for 100% of your total mark and the deadline for submission is week 7, Monday 15th/March/2021 (Submission date is subject to change).
Part One: Data Analytics using Excel (50%).
You need to download the data file titled: “AG Tradeflows-2020 (CW-Data)”, also you need to watch the video titled “BDA Coursework Data File”. Both the data file and related video explaining the data set are available on LC under the tab “Assessment & Feedback”.
For part two you are required to submit two files a PDF/Word Document and an Excel working file.
PDF/Word document: 1) Introduction (150 words): explain from your perspective the objective of this coursework. 2) Stage one (200 words): summarise the tasks completed in this part and reflect on the change of sample size from one task to another. 3) Stage two (500 words): reflect on your analysis and designing your display panel. Stage three (500 words): provide short essay type of answers to the questions. 4) Conclusion (150): a self- reflection on your learning after completing this coursework by providing (e.g. pros vs cons analysis).
Excel Spreadsheet: you need to structure a similar spreadsheet to the one explained in the “Case Study: US Crude Oil Trade Flows”, which is part of week 8 learning material.
In doing so you are required to complete the following tasks:
Stage One:cleaning, manipulating and structuring the dataset.
You are required to clean and manipulate the dataset “AG-Tradeflows-2020” prior running analysis and structuring your final display panel.
1) Before cleaning the data (by deleting not needed data columns) you need to filter the dataset to only include shipments from “Saudi Arabia” and only for the period 2020 by filtering the data columns “Load Country” and “Departure Data”, respectively and accordingly. (2%)
2) Create the following new variable “Cargo” by multiplying the column “Volume” by 1000 (Volume × 1000). (2%)
3) Filter the dataset to include only the following indicators (columns): Vessel Name, Vessel IMO, Load Port, Departure Date, Discharge Country, Discharge Port, Product, Grade, Cargo, Discharge Country/Sub-Country, Discharge Region, Discharge Zone. (2%)
4) Filter the dataset to exclude observations with missing values by deleting observations that include blank or error data for the following data columns: Vessel Name, Load Port, Departure Date and Discharge Port. (2%)
5) Create the following new variables: Vessel Type and DWT by merging information from the second table (LOOKUP) sheet into the main dataset. (6%)
6) After merging both datasets use the new structured column data indicator “Vessel Type” to filter the dataset to only include four vessel types namely, 1) Crude Oil Tanker, 2) Products Tanker, 3) Chemical/ Products Tanker, 4) Crude/Oil Products Tanker. (2%)
7) The final sample should only include the following variables “Vessel”, “Vessel Type”, “DWT”, “Load Port”, “Departure Date”, “Discharge Country”, “Discharge Port”, “Product”, “Grade”, “Cargo”, “Discharge Country/Sub-Country”, “Discharge Region” and “Discharge Zone”. (2%)
i. Check the data type (format) of these variables and if necessary, modify the data type.
ii. Check if these variables contain missing values. Exclude all observations where at least one of these variables contain missing values.1
(2%)
Note: each step should be clearly shown in a separate sheet of the spreadsheet.
Stage Two: data analysis and designing the display panel.
8) Create a monthly time series of vessels shipments (a count of number of monthly fixed ships), total cargo shipped and cargo capacity utilization. (3%)
9) Plot a monthly time series showing total number of vessels shipments and total cargo capacity loaded onboard ships. You need to provide a table with the data used to plot the time series. (3%)
10) Identify the month that had the highest number of vessel shipments, the most loaded cargo in tonnes and percentages of cargo capacity utilization. (3%)
11) Structure tables and provide suitable illustrations that categorises total shipments and cargo capacity by vessel type, load port, type of product and discharge zone. (3%)
12) Similar to the Case Study: US Crude Oil Trade Flows, which is part of week 8 learning material, you need to structure your spreadsheet providing tables and illustrations and design a display panel. (3%)
Note: each step should be clearly shown in a separate sheet of the spreadsheet.
Tip 1: this will reduce the sample size significantly.
Stage Three: answer the following questions.
13) Historical time series may contain useful information that are useful for decision makers. Do you see any pattern in the monthly time series of vessels shipments and total cargo capacity? (5%)
14) Forecasts are required to support decisions in the future. We need to provide forecast thatsupports operational planning one month in advance. Use naïve and simple moving average to provide one-month ahead forecast. Reflect on which approach do you recommend to use for this forecasting task? Explain your answer and plot your forecasts. (5%)
15)Reflect on how useful a Linear Programming method for this type of data (e.g. cargo capacity, amount of cargo shipped, different sizes of vessels, … etc.). (5%)
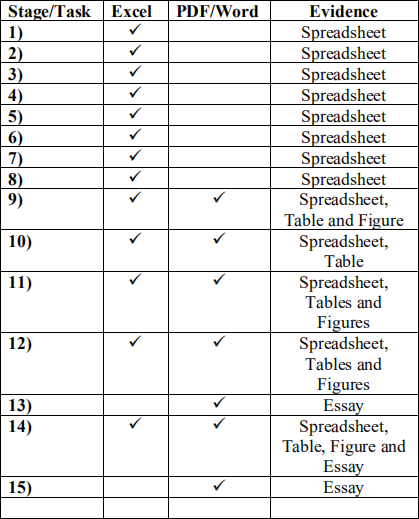
Information included in submitted files:
Part 2: Data Analytics using R (50%).
Data analytics is generally used to provide evidence and inform decisions. In a typical business data analytic task, you can use data to inform decisions, verify claims and assumptions, answer or refine questions. In this part of the coursework, you are first asked to choose a dataset and discuss a relevant problem to the dataset that needs to be informed by data analysis, it could be in the form of questions, claims or assumptions.
Data
In order for you to have the greatest chance of success with this coursework it is important that you choose a manageable dataset. This means that the data should be readily accessible and large enough that multiple relationships can be explored. As such, your dataset must have at least 50 observations and between 3 to 20 variables (exceptions can be made but you must speak with me first). The variables in the data should include categorical variables, discrete numerical variables, date/time variables and continuous numerical variables. The dataset format could be in the format of text(.txt) or excel (.csv /.xls, .xlsx)
If you are using a dataset that comes in a format that we haven’t encountered in class, make sure that you are able to load it into R as this can be tricky depending on the source. If you are having trouble, ask for help before it is too late.
Note on reusing datasets from class: Do not reuse datasets used in examples, homework assignments, or labs in the class.
You can use a publicly available dataset of your choice, few resources to find datasets include:
• NHS Scotland Open Data
• NHS UK Data
• Bikeshare data portal
• UK Gov Data
• TidyTuesday
• Kaggle datasets
• OpenIntro datasets
• Awesome public datasets
• Youth Risk Behavior Surveillance System (YRBSS)
• PRISM Data Archive Project
• Harvard Dataverse
• State Wales dataset
• Edinburgh Open Data
• Open access to Scotland’s official statistics
• Anything else
Deliverables
1. A zip file containing the whole project, it should include RMarkdown file, data, and any other files such as images, rscripts etc used in the project
2. A pdf file which is created from the Rmarkdown
Once you have the data, you need to follow these steps:
1. Create a new project in Rstudio
2. Create a new RMarkdown file and save it into the project folder
3. Create a folder (data) in your project folder and put your data there
▪ If you use any rscript create a new folder (rscrip) and put all files there
▪ If you use any image in your report, create a folder (img) in your project folder
4. Your Rmarkdown file should contain the following sections:
▪ Introduction:
The introduction should introduce your general topic and what you aim to do and most importantly
▪ Business context and research questions
Describe your research question and what you want to know about your data
▪ Data
Describe where it came from, how it was collected, what are the variables, etc.
▪ Data analysis
• Include some data wrangling to ensure the data quality and it is in a suitable format for your analysis
• Include some summary statistics
• You need to make sure that you use an appropriate visualisation to answer your questions and
• Some explanation on how the visualisation/s help you learn more about your data. What is your conclusion based on that?
Marking
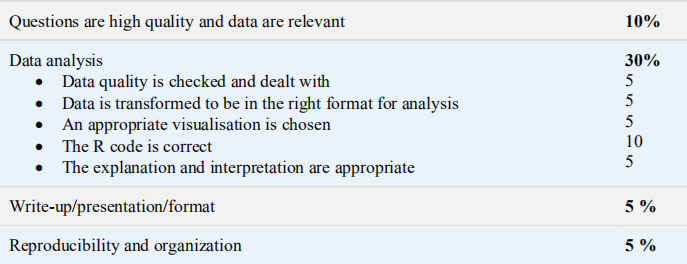
General Criteria
• Content - What is the quality of research and/or policy question and relevancy of data to those questions?
• Correctness - Are data wrangling, visualisation and related R code carried out and explained correctly?
• Writing and Presentation - What is the quality of the presentation, writing, and explanations?
• Creativity and Critical Thought - Is the project carefully thought out? Are the limitations carefully considered? Does it appear that time and effort went into the planning and implementation of the project?
The coursework should be NO MORE THAN 3,000 WORDS IN LENGTH and all sources should be acknowledged in the appropriate place in the text. You are advised to use the Cardiff Harvard referencing system.
Submission is week 7, Monday 15th/March/2021 (Submission date is subject to change). Essays must be submitted online on Learning Central BEFORE 11:00 a.m.
Note: You are also advised to attach a cover sheet containing: the module code, module title, lecturer’s name, scheme of study and student number.
References
Ensure all sources of information are referenced correctly using the Cardiff Harvard Style of Referencing – if unsure see the handout from the library.
Unfair Practice
This is an individual assignment, and you are advised not to engage in any activity that might lead to suspicions of Unfair Practice. Details of the University Regulations may be found at https://intranet.cardiff.ac.uk/students/your-study/exams-and-assessment/sitting-yourexam/cheating-and-unfair-practice and you should familiarise yourself with these regulations before starting your coursework.
On the front page of the assignment, you should include:
§ Student number
§ Title of coursework
§ Title of Module and module number
§ Name of lecturer
§ Date of submission
§ Word count
Students are advised to keep a second copy for themselves. Should there be special circumstances that mean you are unable to meet the submission deadline, you must obtain an extension from the Chair of the Board of Examiners. Forms are available from room A-04 or Learning Central. If you are not in Cardiff then contact your Personal Tutor.
Good luck
Dr. Wessam Abouarghoub & Dr. Bahman Rostami-Tabar
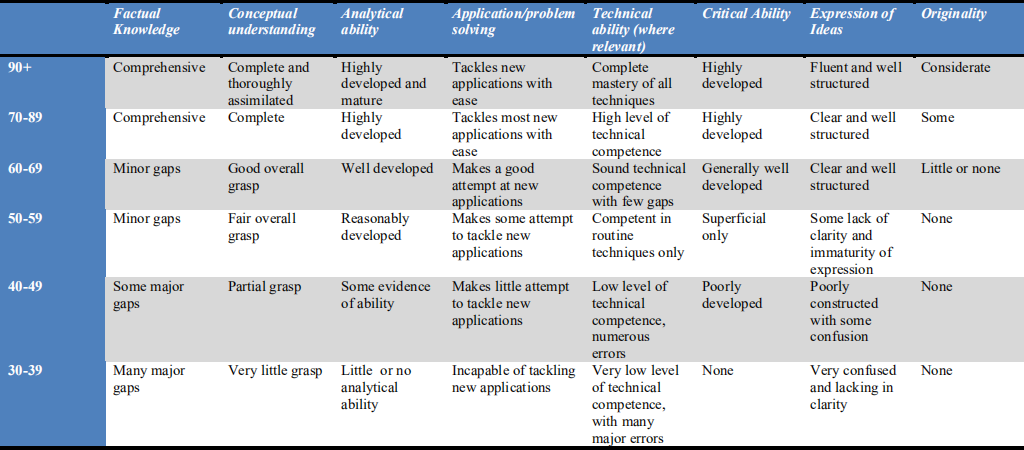
Coursework marking-criteria
For 90%+
An outstanding piece of work, showing mastery of the subject matter, with a highly developed ability to analyse, synthesise and apply knowledge and concepts. All objectives of the assignment are covered and the work is free of error with very high level of technical competence. There is evidence of critical reflection; and the work demonstrates originality of thought, and the ability to tackle questions and issues not previously encountered. Ideas are expressed with fluency. All coursework requirements are met and exceeded.
For 70% - 89%
An excellent piece of work, showing a high degree of mastery of the subject matter, with a well-developed ability to analyse, synthesise and apply knowledge and concepts. All major objectives of the set work are covered, and work is free of all but very minor errors, with a high level of technical competence. There is evidence of critical reflection, and of ability to tackle questions and issues not previously encountered. Ideas are expressed clearly. However the originality required for a 90+ mark is absent. All coursework requirements are met and some are exceeded.
For 60%-69%
A very good piece of work, showing a sound and thorough grasp of the subject-matter, though lacking the breadth and depth required for a first class mark. A good attempt at analysis, synthesis and application of knowledge and concepts, but more limited in scope than that required for a mark of 70+. Most objectives of the work set are covered. Work is generally technically competent, but there may be a few gaps leading to some errors. Some evidence of critical reflection, and the ability to make a reasonable attempt at tackling questions and issues not previously encountered. Ideas are generally expressed with clarity, with some minor exceptions. All coursework requirements are addressed adequately.
For 50%-59%
A fair piece of work, showing grasp of major elements of the subject-matter but possibly with some gaps or areas of confusion. Only the basic requirements of the work are covered. The attempt at analysis, synthesis and application of knowledge and concepts is superficial, with a heavy reliance on course materials. Work may contain some errors, and technical competence is at a routine level only. Ability to tackle questions and issues not previously encountered is limited. Little critical reflection. Some confusion and immaturity in expression of ideas. Most coursework requirements are addressed.
For 40%-49%
A poor piece of work, showing some familiarity with the subject matter, but with major gaps and serious misconceptions. Only some of the basic requirements of the work set are achieved. Little or no attempt at analysis, synthesis or application of knowledge, and a low level of technical competence, with many errors. Difficulty in beginning to address questions and issues not previously encountered. Some intended learning outcomes are achieved.
For 30%-39%
Work not of passable standard, with serious gaps in knowledge of the subject matter, and many areas of confusion. Few or none of the basic requirements of the work set are achieved, and there is an inability to apply knowledge. Technical competence is poor, with many serious errors. The student finds it difficult to begin to address questions and issues not previously encountered. The level of expression and structure is very inadequate. Few intended learning outcomes are achieved.
Below 30%
A very poor piece of work, showing that the student has failed to engage seriously with any of the subject matter involved, and/or demonstrates total confusion over the requirements of the work set. Virtually none of the intended learning outcomes are achieved.
Marking Grid
2021-03-05