STAT 292 Assignment 1 School of Mathematics and Statistics
School of Mathematics and Statistics
Te Kura M¯atai Tatauranga
STAT 292 Assignment 1: Due Thursday, 11 March 2021 at 11:59 PM
Note: Your assignment can be typed or handwritten (and scanned). Be sure to submit your assignment as a PDF and follow the instructions specified on the course Blackboard page. Where calculations are performed in R, be sure to include relevant code and output with your answer.
1. (3 marks)
Which of the following variables are categorical?
a. Level of calcium in the blood (micrograms per millilitre).
b. Age (years).
c. Attitude toward gun control (favour or oppose).
d. Smoker (yes or no).
e. Anxiety rating (1 = “None”, 2 = “Mild”, 3 = “Moderate”, 4 = “Severe”, 5 = “Very severe”).
f. Systolic blood pressure (millimetres of mercury).
2. (20 marks)
Let the number of unemployed people in a group of 12 be a binomial random variable Y with n = 12 and p = 0.25 (i.e., the probability of being unemployed for each of the people in the group is 0.25).
a. Clearly explain what we are assuming about these 12 people in representing the number of them who are unemployed by a binomial distribution? (Your answer must clearly refer to the situation described in the problem.) (4 marks)
b. Obtain E(Y ) and V(Y ) (to 2dp). (4 marks)
c. Find P(Y = 2) (to 4dp). (If using R to calculate this probability, be sure to include your code and output.) (2 marks)
d. Find P(Y ≥ 4) (to 4dp)
i. exactly using R and the binomial distribution and
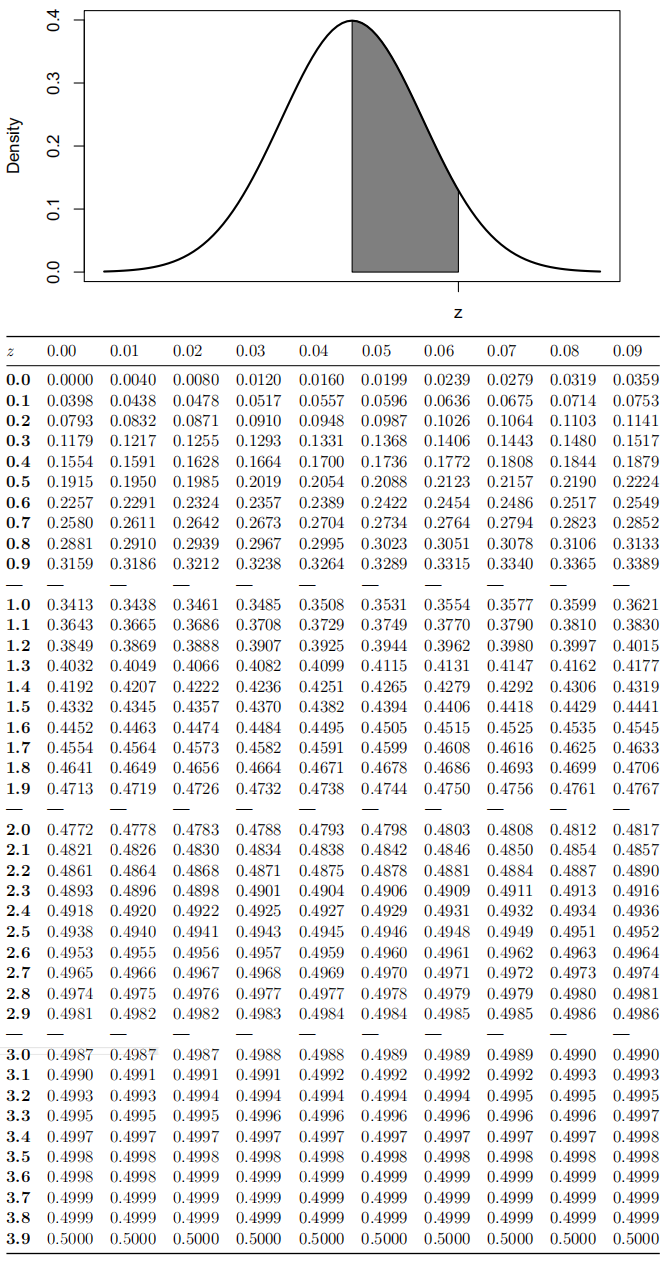
ii. by hand using a normal approximation and the standard normal probability table.
(8 marks)
e. Why do you think the normal distribution is not providing a better approxima-tion to the exact binomial probability in part (d)? (2 marks)
3. (5 marks)
Suppose a government wants to estimate the proportion of residents who live at or below the poverty level. They would like to produce a 99% confidence interval for this proportion. Find the most conservative minimal sample size required to produce a confidence interval with an approximate margin of error of 0.01.
4. (18 marks)
Consider the following data showing random samples of recent university graduates with bachelor’s degrees and master’s degrees and the numbers of these graduates who remained in the same job for the first three years after graduating. Relevant data are shown in the table below.
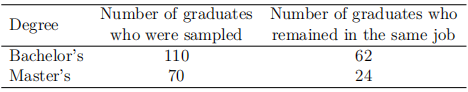
a. Produce both a standard and an Agresti-Coull 95% confidence interval (to 3dp) for the proportion of bachelor’s degree graduates who remain in the same job for three years immediately after graduating from university. (7 marks)
b. Test whether the proportion of bachelor’s degree graduates remaining in the same job for three years immediately after graduating from university is different than that of master’s degree graduates using a test for proportions. Carry out the test by hand at the α = 0.05 significance level. (The p-value should be calculated using the standard normal probability table.) (11 marks)
5. (19 marks)
The following data shows the number of no-shows (i.e., people who fail to keep their reservations) for 92 days for the daily 4:00 PM flight from Wellington to Auckland.
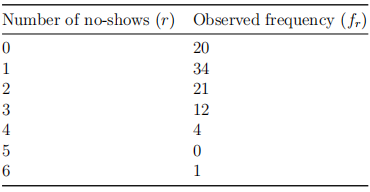
a. Find the mean number of no-shows per flight (to 3dp). (3 marks)
b. Test whether the number of no-shows for the daily 4:00 PM flight from Welling-ton to Auckland is consistent with a Poisson distribution. Be sure to clearly state the null and alternative hypotheses, present the test statistic and its dis-tribution under the null hypothesis, and report the p-value and your conclusion at the α = 0.05 significance level. (16 marks)
Standard Normal Probability Table
2021-02-25