Statistical Inference and Modeling Graded Homework 1 Spring 2021
You are free to present your solutions to the exercises below in groups of at most three. If you work alone you can submit any 4 of the 5 exercises below. Each will count as 30 points. If you work in a group, then the first 4 exercises will count as 25 points and the bonus exercise 20 points.
This homework is due on February 2 at the beginning of that day’s class. Good luck!
Exercise 1
Assume the life times of the neon lamps in a building can be modeled by an exponential distribution (i.e. let D be a random variable representing the lifetime of a lamp, then the probability density function of D is f(d; λ) = 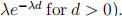
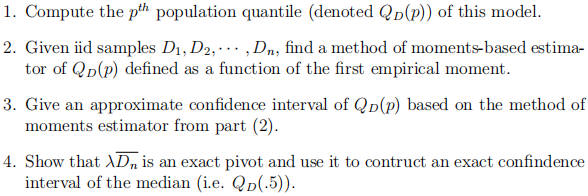
We would like to construct point and interval estimates of the quantiles of the survival time.
Exercise 2
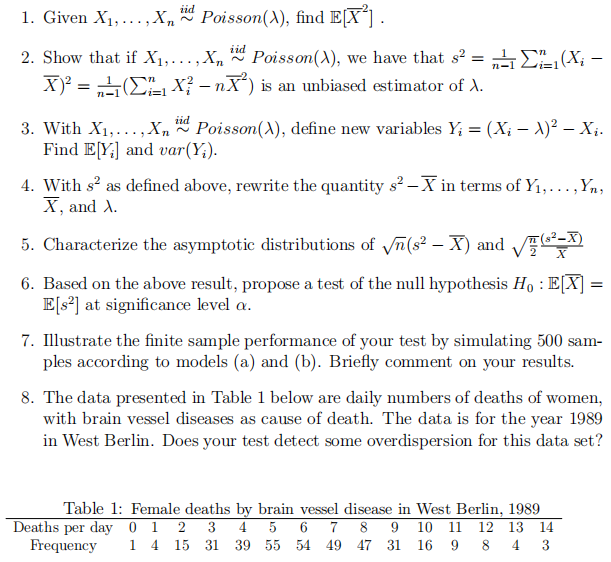
The Poisson model assumes that the population mean equals the population variance. However, in practice it is common to encounter count data where the observed variance is significantly larger than mean. This phenomenon is called overdispersion. The goal of this exercise is to construct an asymptotic test of overdispersion, which you will propose and evaluate. You are free to present the results in either tables or plots, but limit yourselves to at most 2 pages of output including some lines of code. In your simulations, you will generate samples corresponding to the following two models:
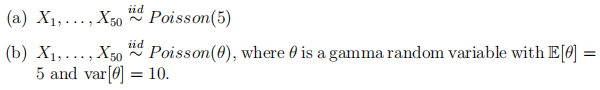
The first model will serve to verify that the test provides the desired confidence level. The second will serve to check the power of the test.
Let’s start with some theoretical considerations.
Let 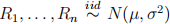 be observations representing earnings of shares in a portfolio, where µ and
  are unknown parameters. We would like to find an estimator of
Exercise 4
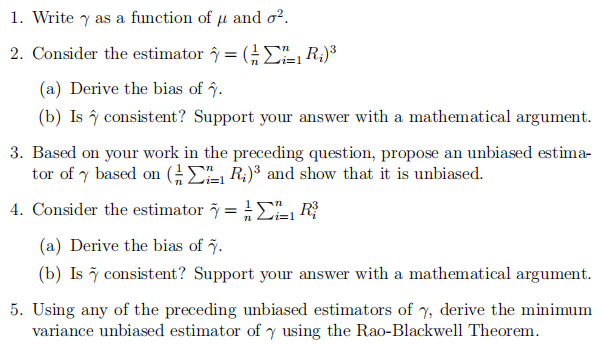
The dataset liver.csv consists of measurements of measurements of the per capita liquor consumption and cirrhosis mortality rate for 46 different geographical regions. The two variables are liquor consumption per capita (ounces) and cirrhosis mortality rate, i.e. deaths per 100,000 people. Cirrhosis is condition in which the liver does not function properly due to long-term damage.
The goal of this exercise is to use straight line linear regression framework to analyze these data. Provide a minimum amount of R output to justify your answers.
Exercise 5 (Optional bonus question)
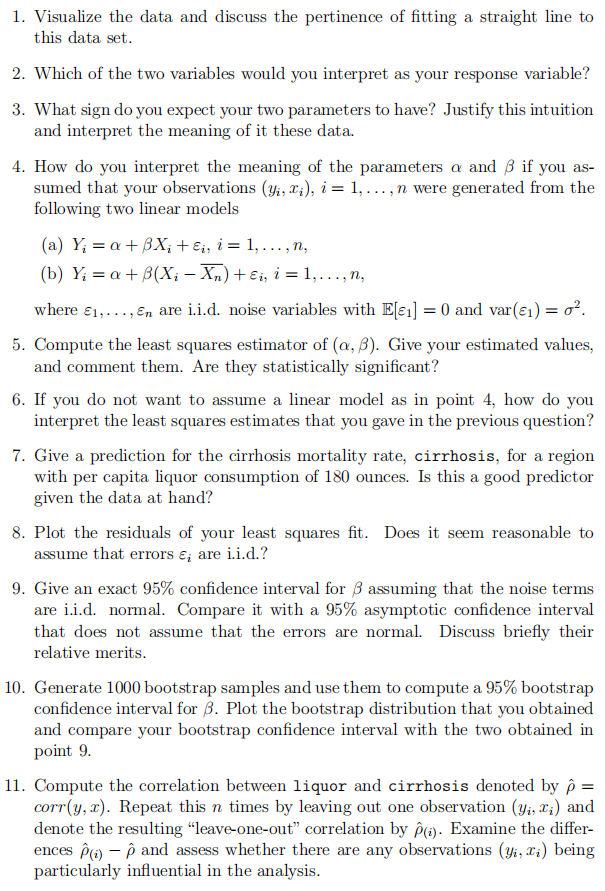
Let’s revisit the data set of scientific discoveries studied in Simonton (1979) 1. You will check the pertinence of the statistical model proposed by the other and study an alternative approach. Print the code and output of your analysis when answering the questions below. The code and output should not exceed two pages.
2021-02-05