Assignment
Model 1: Pollution [35 marks]

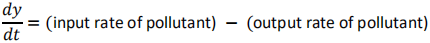
In fluid dynamics, we use the term convection to refer to the transfer of fluid in a system due to its motion. We can use an ordinary differential equation to model the transport within the system of such fluids (e.g. water, gasoline) or substances dissolved in these fluids (e.g. salt, oxygen, pollutants), by modelling the change in the amount of fluid (or substance) with respect to time as the balance between inflowing and outflowing fluid. One application of such models is to study the environmental impact of large chemical spills, caused by industrial accidents, in order to manage them better.
Suppose that due to an environmental accident, polluted water starts to flow into a lake of volume 
 at a constant flowrate
  Water leaves this lake through a channel at a constant flowrate
  The concentration of pollutant in the incoming water is
  The change in the amount of pollutant y deposited in this lake as a function of time t is given by a differential equation of the type:
a) [15%] Derive a mathematical model for the amount of pollutant y (t ) [kg] deposited in the lake as a function of time by solving the differential equation above. Use dimensional analysis to show your model is dimensionally correct.
b) [15%] Knowing that this lake’s ecosystem will be irreversibly damaged when the concentration of pollutant reaches 331 g
derive an expression for the total time that local authorities have to take action on this issue from the moment pollution starts flowing into this lake. Support your answer with a graph.
c) [40%] Derive a mathematical expression for the time
it takes until the concentration of pollutant in the lake,
reaches 95% of its steady state concentration given by:

Indicate what the region of steady state concentration is in a plot of
By analysing the curve for
describe what is a steady state regime in your own words. Discuss how the lake’s volume and the balance between
and
affect the time that it takes for the concentration of pollutant in the lake to reach steady state.
d) [30%] If local authorities act quickly enough and pollution into the lake is stopped when the pollutant concentration in the lake is at 213 g
calculate how long it will take for the lake to clear out and have pollutant concentrations < 5 g
Design a mathematical model for the clearing of the lake and support your answer with a graph.
Guidance for questions asking for a graph:
You will need to assume values for , , and  . You can use your experience of Fermi problems in Week 2 to help you make reasonable assumptions. Here are some hints for plotting your graph:
• Think about how
• When choosing a value for
• You might need to plot
for large time intervals. As a reference, if
,
and
, plotting
hours on a linear scale, and 0 to
hours on a logarithmic scale on the horizontal axis.
• In letters (b) and (d) your graph needs to show the relationship between the pollution concentration given by
and time t , highlighting the relevant points for each question.
Model 2: Decay [25 marks]

Carbon dating is a type of radioactive dating that allows us to date matter that was once living. The radioactive isotope carbon-14 is produced at relatively constant rate in the atmosphere, and like the stable carbon-12, combines with oxygen to form carbon dioxide, which exists in all living things. When an organism dies, its level of carbon-12 remains constant, but the levels of carbon-14 decay with rate
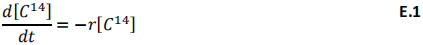
where r is a constant in  . We know that the initial condition is
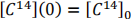
 .
.
a) [30%] If it takes 5730 years for the levels of carbon-14 in a sample to drop by half, use equation 1 to show that
.
The fraction of carbon-14 to carbon-12 remains relatively constant in living organisms, so we can determine how long an organism has been dead by measuring this ratio and determining how much carbon-14 has radiated away. Researchers usually measure this ratio in units of modern carbons M =  . In a living organism, M = 1 (this is our initial condition).
b) [40%] Express E.1 in terms of M, and solve for M.
One of the major applications for carbon dating is in studying human evolution and the development of civilisations by providing a chronological timeframe for archaeological findings. One such important recent finding was the discovery of the oldest Homo sapiens remains in Europe.
This particular individual is of even greater interest as it was determined he had a recent Neanderthal ancestry, making dating when he lived with a good degree of accuracy important for our understanding of how Homo sapiens migrated from Africa to Eurasia. To this end, five measurements of M were made in Oxford and Groningen, yielding the results:
TABLE 1. MEASUREMENT DATA.
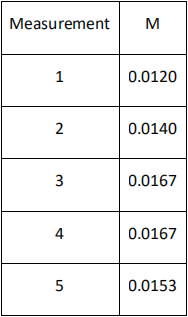
c) [30%] You are required to use this data to estimate the 95% confidence interval of when this individual lived. Notice you will find a time period dating from when the individual passed away to when the measurements were taken.
Model 3: Uncertainty [40 marks]

In practice, many engineering systems, processes or projects can be affected by random events, whose nature and incidence are difficult to predict. For example, construction projects can be delayed by work restrictions imposed by a global pandemic, mass-produced machined parts can have defects at random intervals, and transport delays can be caused by unforeseen accidents. The more complex engineering systems are, the greater degree of uncertainty is associated with their behaviour. Our understanding of how such systems behave relies on data acquisition and statistics for making inferences and predictions.
In this model you will be required to demonstrate your data analysis abilities and statistical knowledge to better understand and manage air travel.
Part 1.
The data in Table 2 shows the 2019 annual punctuality statistics of flights leaving London Heathrow with destination to China, according to the 2019 report from the UK’s Civil Aviation Authority (CAA) [1]. This table shows a discrete approximation of the probability that flights from Heathrow via certain airlines will arrive either early or late at their destination.
a) [10%] At which Chinese airports flights arriving from Heathrow are more likely to be early than late? Support your answer with numeric evidence.
b) [15%] Suppose that you work at the UK CAA. You are asked to rank the airline flights arriving at Shanghai Pu-Dong airport (that departed from Heathrow) in terms of their punctuality. Show how early/late flights from each airline are expected to be and present a numerical measure of the reliability of your predictions.
Part 2.
Passengers landing at Heathrow airport need to go through passport control checks in order to enter the UK. EU and UK nationals use a fast-track system, where they scan their passport at a self-service station, where queue times average 20 minutes with 5 minutes standard deviation. Non-UK/EU nationals need to have their passports checked by the UK Border Force, a process that is often longer, with queue times averaging 30 minutes and approximately 15 minutes standard deviation.
The rate of change of the number of passengers queueing within the borders of Heathrow airport for passport control can be approximated as:
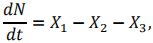
where  is a random variable representing the number of passengers arriving at Heathrow per hour,
  is a random variable representing the number of passengers that have gone through passport control per hour, and
  is a random variable representing the number of transit passengers.
In more detail, the random variable  can be modelled as:
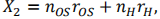
where  is the number of staffed gates open for overseas passengers and
  is the number of passengers a certain gate can service per hour. Similarly,
  is the number of gates open for UK/EU nationals, and
  is the rate of passengers going through that gate per hour. Table 3 shows a monthly breakdown of the nationalities of passengers arriving at London Heathrow airport throughout 2019, and Table 4 shows the total number of terminal and transit passengers at London airports in 2019.
a) [5%] Find a suitable approximation for the number of transit passengers
at the airport. Show the mean and variance of this random variable.
b) [35%] Estimate the number of gates that need to be open in order to ensure the queues of passengers waiting to go through passport control does not increase with time. Use the data in the tables provided alongside realistic estimates for the rate at which passengers go through the two types of passport control gates (Home/Overseas). You can use your experience of Fermi problems in Week 2 to help you make reasonable assumptions.
c) [35%] Build a mathematical model to predict how passport control queues change as a function of the number and type of tills open. Consider the uncertainty of your model. Based on your model, recommend a till opening strategy for the airport.
TABLE 2. PUNCTUALITY STATISTICS FOR FLIGHTS LEAVING HEATHROW AND LANDING IN CHINA (2019).
|
|
|
% Early | % Late | |||||||
|
Destination City
|
Airline
|
22 min
|
7 min
|
8 min
|
23 min
|
46 min
|
91 min
|
151 min
|
271 min
|
450 min
|
|
BEIJING
|
AIR CHINA
|
14.03 | 32.04 |
28.72
|
11.12
|
8.95
|
3.72
|
0.75
|
0.20
|
0.45
|
|
BEIJING
|
BRITISH AIRWAYS PLC
|
22.32
|
21.47
|
33.39
|
11.07
|
5.96
|
3.92
|
1.19
|
0.34
|
0.34
|
|
BEIJING DAXING INT AIRPORT
|
BRITISH AIRWAYS PLC
|
9.30
|
21.71
|
39.53
|
12.40
|
6.98
|
5.43
|
3.88
|
0.00
|
0.78
|
|
GUANGZHOU BAIYUN INT
|
CHINA SOUTHERN
|
24.03
|
43.49
|
17.82
|
7.39
|
5.04
|
1.64
|
0.23
|
0.23
|
0.12
|
|
CHANGSHA HUANGHUA INT AIRPORT
|
HAINAN AIRLINES
|
12.59
|
39.12
|
30.61
|
9.52
|
5.10
|
0.68
|
1.36
|
0.68
|
0.34
|
|
CHENGDU
|
AIR CHINA
|
11.74
|
31.30
|
26.52
|
13.91
|
8.70
|
3.91
|
0.00
|
0.43
|
3.48
|
|
QINGDAO
|
BEIJING CAPITAL AIRLINES
|
30.08
|
42.37
|
11.86
|
7.63
|
4.66
|
1.27
|
0.42
|
0.00
|
1.69
|
|
SHANGHAI (PU DONG)
|
BRITISH AIRWAYS PLC
|
9.12
|
31.91
|
36.97
|
10.80
|
6.54
|
2.97
|
0.50
|
0.40
|
0.79
|
|
SHANGHAI (PU DONG)
|
CHINA EASTERN AIRLINES
|
5.80
|
30.39
|
30.80
|
14.09
|
12.02
|
5.66
|
0.69
|
0.41
|
0.14
|
|
SHANGHAI (PU DONG)
|
VIRGIN ATLANTIC LTD
|
13.32
|
33.93
|
33.52
|
8.65
|
6.59
|
2.47
|
0.96
|
0.27
|
0.27
|
|
SHENZHEN (HUANGTIAN)
|
SHENZHEN AIRLINES
|
7.57
|
26.50
|
28.71
|
15.14
|
13.56
|
6.62
|
0.95
|
0.00
|
0.95
|
|
TIANJIN
|
TIANJIN AIRLINES
|
12.24
|
32.78
|
18.88
|
12.03
|
12.24
|
3.73
|
0.21
|
0.00
|
7.88
|
|
WUHAN TIANHE INT
|
CHINA SOUTHERN
|
17.31
|
42.63
|
17.95
|
6.09
|
9.29
|
5.45
|
0.96
|
0.32
|
0.00
|
|
ZHENGZHOU XINZHENG
|
CHINA SOUTHERN
|
4.00
|
36.00
|
17.00
|
16.00
|
20.00
|
7.00
|
0.00
|
0.00
|
0.00
|
TABLE 3. HEATHROW MONTHLY TRAFFIC STATISTICS BY NATIONALITY (2019).
|
Month
|
UK
|
EU
|
Non-EU Europe
|
Africa
|
North America
|
Latin America
|
Middle East
|
Asia / Pacific
|
Total
|
|
January 2019
|
326,386
|
1,817,088
|
426,466
|
313,497
|
1,277,923
|
121,749
|
628,759
|
1,015,675
|
5,927,543
|
|
February 2019
|
320,861
|
1,859,085
|
418,782
|
273,567
|
1,088,818
|
106,026
|
541,573
|
873,576
|
5,482,288
|
|
March 2019
|
391,467
|
2,217,166
|
487,150
|
303,704
|
1,470,992
|
114,644
|
597,277
|
945,089
|
6,527,489
|
|
April 2019
|
419,327
|
2,319,492
|
480,811
|
301,144
|
1,557,547
|
112,837
|
677,609
|
929,445
|
6,798,212
|
|
May 2019
|
435,701
|
2,404,663
|
445,300
|
261,598
|
1,706,145
|
113,709
|
518,061
|
883,726
|
6,768,903
|
|
June 2019
|
431,711
|
2,536,137
|
504,697
|
280,538
|
1,807,271
|
116,985
|
607,953
|
961,305
|
7,246,597
|
|
July 2019
|
446,608
|
2,689,689
|
552,150
|
302,642
|
1,833,961
|
122,240
|
746,174
|
1,060,675
|
7,754,139
|
|
August 2019
|
437,054
|
2,619,533
|
535,723
|
312,796
|
1,829,388
|
121,380
|
790,105
|
1,034,348
|
7,680,327
|
|
September 2019
|
388,187
|
2,333,969
|
469,720
|
277,583
|
1,615,711
|
109,523
|
643,594
|
938,828
|
6,777,115
|
|
October 2019
|
432,183
|
2,420,621
|
478,882
|
292,290
|
1,677,327
|
114,544
|
643,064
|
1,005,868
|
7,064,779
|
|
November 2019
|
414,684
|
2,090,235
|
422,161
|
284,821
|
1,416,945
|
111,486
|
613,100
|
880,369
|
6,233,801
|
|
December 2019
|
396,168
|
2,153,470
|
471,837
|
310,426
|
1,552,509
|
117,139
|
743,168
|
951,362
|
6,696,079
|
TABLE 4. HEATHROW TERMINAL AND TRANSIT PASSENGERS STATISTICS OVER A YEAR (2019).
|
Airport
|
Total Passengers
|
Terminal
|
Transit
|
|
GATWICK
|
46576473
|
46574786
|
1687
|
|
HEATHROW
|
80890031
|
80886589
|
3442
|
|
LONDON CITY
|
5122271
|
5122271
|
0
|
|
LUTON
|
18216207
|
18213901
|
2306
|
|
SOUTHEND
|
2035535
|
2035535
|
0
|
|
STANSTED
|
28124292
|
28124292
|
0
|
2021-02-01