DS 1000 Assignment 1 2022
Hello, dear friend, you can consult us at any time if you have any questions, add WeChat: daixieit
DS 1000
Assignment 1 – 2022
• Questions with the computer symbol :must be answered using Python . All code must be provided.
• Submissons must be done via Gradescope .
Question 1 (10 pts)
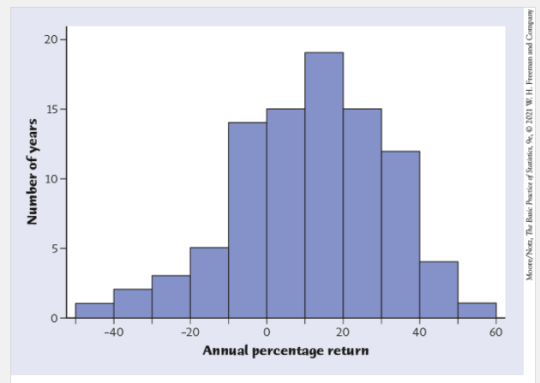
Returns on the S&P. The return on a stock is the change in its market price plus any dividend payments made over some period. Total return is usually expressed as a percentage of the beginning price. Figure 1.19 is a histogram of the distribution of the annual combined returns for all stocks listed on the S&P 500 from 1928 to 2018 (91 years).
a) (2.5 pts) Describe the overall shape of the distribution of monthly returns.
b) (2.5 pts) What is the approximate center of this distribution? (For this question, take the center to be the value with roughly half the years having lower returns and half having higher returns.)
c) (2.5 pts) Approximately what were the smallest and largest annual returns? (This is one way to describe the variability of the distribution.)
d) (2.5 pts) A return less than zero means that stocks lost value in that year. About what percentage of all years had returns less than zero?
Question 2 (20 pts)
She Sounds Tall! Presented with recordings of a pair of people of the same sex speaking the same phrase, can a listener determine which speaker is taller simply from the sound of their voice? Twenty-four young adults at Washington University listened to 100 pairs of speakers and, within each pair, were asked to indicate which of the two speakers was the taller. Here are the number correct (out of 100) for each of the 24 participants:

Researchers believe that the key to correct discrimination is contained in a particular type of sound produced in the lungs, whose frequency is lower for taller people.
a) (5 pts) Make two stemplots, with and without splitting the stems. Which plot do you prefer, and why?
b) (2.5 pts) Describe the shape, center, and variability of the distribution in words without necessarily calculating sample statistics.
c) (2.5 pts) Without using any software, calculate the mean and median of these data. Show all your work.
d) (5 pts) Without using any software, calculate the first and third quartiles of these data. Show all your work.
e) (5 pts) If the experimental subjects are just guessing which speaker is taller, they should correctly identify the taller person about 50% of the time. Does this data support the researchers’ conjecture that there is information in a person’s voice to help identify the taller person? Why or why not?
Question 3 (15 pts)
Consider the following values representing the age of group of 10 adults: 31, 35, 33, 31, 29, 34, 29, 30, 29, and 28. Without using any software, compute the mean and standard deviation for these data. Show all your work.
Thefollowing questions (4 to 7) will require programming in Python.
Question 4 :(10 pts)
(dataset ex01-25carcolor.csv) What Color Is Your Car? The most popular colors for cars and light trucks vary with region and type of vehicle and over time. In North America, silver and white are the most popular choices for midsize cars, silver and black for convertibles and coupes, and white for light trucks. Despite this variation, overall white remains the top choice worldwide for the eighth consecutive year, increasing its lead by 2% over the previous year. Here is the distribution of the top colors for vehicles sold globally in 2018:
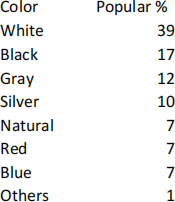
Create a pie chart to display the distribution of color popularity. Colours on the pie chart should match (as close as possible) the colours of the cars.
Question 5 (15 pts)
(dataset tobacco_data.csv) High School Tobacco Use. Despite the intense anti-smoking campaigns sponsored by both federal and private agencies, smoking continues to be the single- biggest cause of preventable death in the United States. How has the tobacco use of high
school students changed over the past few years? High school students were asked whether they had used any of the tobacco products listed in the past 30 days. Here are some of the results:
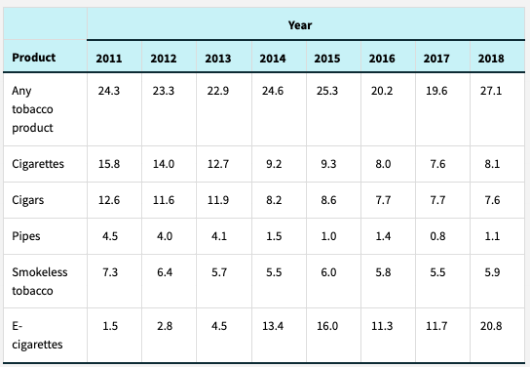
The first row of the table gives the percentages of high school students who had used any tobacco product in the past 30 days for the years 2011–2018. The remaining rows give the percentage of high school students using the most common tobacco products in each of these
years.
a) (5 pts) :Using the information in the first row of the table, create a bar chart
that shows the change in the use of any tobacco product between 2011 and 2018. How would you describe the pattern of change in this usage?
b) (5 pts) :Create a bar chart that illustrates the change in usage in these years for the individual tobacco products. Use a grouped bar chart.
c) (5 pts) Using the bar charts in parts (a) and (b), give a simple description of the changes in the use of tobacco products by high school students between 2011 and 2018.
Question 6 (15 pts)
(dataset ex01-34foodoils.csv) Food Oils and Health. Fatty acids, despite their unpleasant name, are necessary for human health. Two types of essential fatty acids, called omega-3 and omega- 6, are not produced by our bodies and so must be obtained from our food. Food oils, widely used in food processing and cooking, are major sources of these compounds. There is some evidence that a healthy diet should have more omega-3 than omega-6. Table 1.4 gives the ratio of omega-
3 to omega-6 in some common food oils. Values greater than 1 show that an oil has more omega-
3 than omega-6.
a) (5 pts) :Create a histogram of these data, using classes bounded by the whole numbers from 0 to 6.
b) (5 pts) What is the shape of the distribution? How many of the 30 food oils have more omega-3 than omega-6? What does this distribution suggest about the possible health effects of modern food oils?
c) (5 pts) Table 1.4 of the textbook contains entries for several fish oils (cod, herring, menhaden, salmon, sardine). How do these values help answer the question of whether eating fish is healthy?
Question 7 (15 pts)
(dataset ex02-42gastric.csv) Adolescent Obesity. Adolescent obesity is a serious health risk affecting more than 5 million young people in the United States alone. Laparoscopic adjustable gastric banding has the potential to provide a safe and effective treatment. Fifty adolescents between 14 and 18 years old with a body mass index (BMI) higher than 35 were recruited from the Melbourne, Australia, community for the study. Twenty-five were randomly selected to undergo gastric banding, and the remaining 25 were assigned to a supervised lifestyle intervention program involving diet, exercise, and behavior modification. All subjects were followed for two years. Here are the weight losses, in kilograms, for the subjects who completed the study:
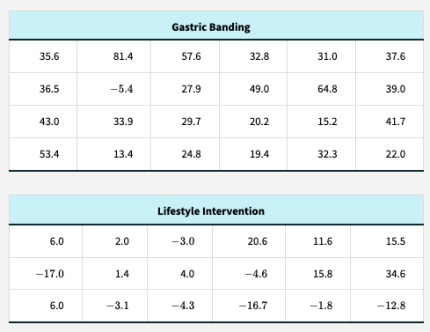
a) (2.5 pts) In the context of this study, what do the negative values in the data set mean?
b) (7.5 pts) :Give a graphical comparison of the weight loss distributions for the two groups, using side-by-side boxplots. Provide appropriate numerical summaries for the two distributions and identify any high outliers in either group. What can you say about the effects of gastric banding versus lifestyle intervention on weight loss for the subjects in this study?
c) (5 pts) The measured variable was weight loss, in kilograms. Would two subjects with the same weight loss always have similar benefits from a weight-reduction program? Does it depend on their initial weights? Other variables considered in this study were the percentage of excess weight lost and the reduction in BMI. Do you see any advantages to either of these variables when comparing weight loss for two groups?
2022-01-29