MSCI 242M Spreadsheet Modelling for Management Individual Coursework 2025
Hello, dear friend, you can consult us at any time if you have any questions, add WeChat: daixieit
MSCI 242M Spreadsheet Modelling for Management
Individual Coursework 2025
Emissions Modelling
With around 1.5 billion cars in the world today, vehicle emissions are a highly relevant topic, in terms of climate change, pollution, electric vehicles (EV) usage, safety, health, noise and sustainability.
The supplied dataset by the Vehicle Certification Agency (VCA) provides fuel efficiency and emissions data for 56 car manufacturers, for over 45,000 vehicles tested between 2015 to 2024.
Each row in the dataset is a test performed by the VCA on a car.
Part A – Volvo Analysis [20 marks]
1. How many VCA tests have been carried out on Volvo cars?
2. How many petrol1Volvo cars have been tested?
3. What is the average MPG2value for Volvo cars, rounded3to 1 decimal place?
4. What is the median CO2 value for Volvo cars, rounded3 to the nearest integer?
5. What is the average MPG2 value for electric-hybrid6 Volvo cars, rounded3 to 1 decimal place?
6. How many Volvo cars are missing a numerical MPG2 value? [note: zero is a number]
7. How many Volvo cars have a transmission code which contains a number? [note: zero is a number]
8. What is the highest CO2 value for a Volvo car?
9. What is the lowest CO2 value for a Volvo car, ignoring all cars with a CO2 value of zero?
10. How loud (in decibels) is the loudest Volvo electricity-only4car?
Part B – Global Analysis [20 marks]
11. How many cars have been tested by the VCA in total?
12. How many diesel5cars have been tested?
13. What is the average MPG2 value for diesel5 cars, rounded3 to 2 decimal places?
14. How many electric-hybrid6cars have been tested?
15. Which manufacturer makes the car with the highest MPG2 value?
16. What is the maximum engine capacity of any car?
17. How many cars do not have a numerical CO2 value? [note: zero is a number]
18. How loud (in decibels) is the loudest car?
19. How loud (in decibels) is the loudest diesel-hybrid7car?
20. What is the model of the loudest diesel-hybrid7 car?
Part C – Analysis of Diesel and Diesel-Hybrids [20 marks]
21. Which manufacturer8has the most diesel5 cars tested?
22. Which manufacturer8 has the most diesel-hybrid7 cars tested?
23. How many manufacturers have no diesel-hybrid7 cars tested?
24. Which type of transmission is the loudest, on average, for diesel5 cars?
25. How many diesel5 or diesel-hybrid7 cars do not have a numerical MPG2 value? [note: zero is a number]
2 Use the ‘Imperial Combined’ MPG value.
3 Round the value using an Excel function. Do not simply format the cell to appear rounded.
4 Electricity-only cars. Do not include any hybrids.
6 An electric-hybrid car is ‘Petrol Electric’ or ‘Electricity / Petrol’ or ‘Petrol Hybrid’ or ‘Diesel Electric’ or ‘Electricity / Diesel’ fuel.
7 A diesel-hybrid car is ‘Diesel Electric’ or ‘Electricity / Diesel’ fuel.
8 If two or more manufacturers share this position, then present the first one alphabetically
Part D – Analysis by Year [20 marks]
26. Which year9saw the most cars tested?
27. Which year9 saw the fewest diesel-hybrids7 tested?
28. Which year9 saw the highest number of manufacturers with at least one electricity-only4 car tested?
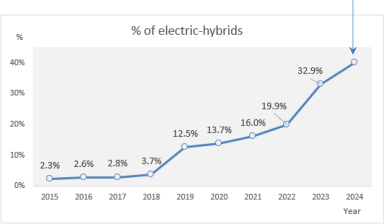
29. The following chart shows the percentage of electric-hybrids6 each year, as a percentage of the total cars tested that year, rounded3 to 1 decimal place. What is the value of the missing data label?
30. Which manufacturer8 registers the lowest yearly average CO2, ignoring any manufacturers that only produced electricity-only4 vehicles in any year.
Part E – Fleet Car Modelling [20 marks]
The sheet ‘Fleet Database’ contains data for 82 journeys made by 14 drivers, using 12 fleet cars.
IMPORTANT: new journey data may be added to this datablock, up to a maximum of 100 journeys in total, so ensure all the results for questions 31 to 35 update automatically when new data is added.
31. Calculate the fuel cost for each journey, rounded3 to the nearest pence, based on the prices given on the ‘Fleet Database’ sheet. Sum across all journeys and present the total cost in the answer cell.
32. Of the drivers with at least 5 journeys, which driver registers the highest distance per journey?
Present the driver code.
If there is a tie for the highest, then present the text ‘tie’ in the answer cell
33. Which of the fleet cars was the most popular, in terms of journeys?
Present the car code.
If there is a tie for the most popular, then present the text ‘tie’ in the answer cell
34. Of the drivers with at least 2 journeys, how many drivers used the same fleet car for every journey?
35. Which drivers used the same fleet car for every journey they made?
If no drivers did, present the text ‘no drivers’ in the answer cell
If only one driver did, present their driver code in the answer cell, e.g. M0044
If multiple drivers did, present all driver codes in the answer cell, each separated by a forward slash / like so: M0044/F0013
9 If two or more years share this value, then present the first year it occurred
Model Design
The design of your model will not be assessed directly. All marks are based solely on the accuracy of your results. However, a well-structured and well-organised model will tend to be more efficient in its calculations, more accurate, and less prone to errors, and penalties may be applied for major design errors (see below).
Data Collection
This coursework is to be completed individually.
The dataset you must use is the last 3 digits of your ID number.
For example, if your ID number is 12345678, then you should use the dataset 678.xlsx
All the datasets are different, so using the incorrect dataset will generate incorrect results.
Do not alter the data in any way, unless directed to do so by the tutor.
If you have any issues about this then you must contact the tutor before submission.
All datasets are held on moodle in a folder called Coursework Data
Submission
Deliverable is an Excel 2024 workbook addressing the tasks, uploaded to moodle.
The model rules are as follows.
Failure to comply with these rules may result in a penalty
![]() All answers must be presented in the correct cells on the User sheet [5 mark penalty]
All answers must be presented in the correct cells on the User sheet [5 mark penalty]
![]() The User sheet should include your ID number
The User sheet should include your ID number
![]() Only correct results will receive the full marks
Only correct results will receive the full marks
![]() The workbook will be assessed on a university-specification PC running Excel 2024
The workbook will be assessed on a university-specification PC running Excel 2024
![]() All answers must be formula or Excel function-based
All answers must be formula or Excel function-based
![]() answers must not be simple/static/pasted values
answers must not be simple/static/pasted values
![]() answers must not be generated by simple sorting/filtering methods. Sorting functions are fine.
answers must not be generated by simple sorting/filtering methods. Sorting functions are fine.
![]() answers must not be found/derived manually by the user
answers must not be found/derived manually by the user
![]() answers must not be based on VBA macros orVBA functions
answers must not be based on VBA macros orVBA functions
![]() The workbook should not contain links to external files
The workbook should not contain links to external files
![]() The workbook should not have any hidden sheets
The workbook should not have any hidden sheets
![]() The workbook should not have any un-named sheets e.g. Sheet1 [5 mark penalty]
The workbook should not have any un-named sheets e.g. Sheet1 [5 mark penalty]
![]() The workbook should not have any circular references [5 mark penalty]
The workbook should not have any circular references [5 mark penalty]
![]() The workbook should not exceed 15MB in size [5 mark penalty]
The workbook should not exceed 15MB in size [5 mark penalty]
2026-01-12