IND5001: Introduction to Industry 4.0 and Applications - Assignment 2
Hello, dear friend, you can consult us at any time if you have any questions, add WeChat: daixieit
IND5001: Introduction to Industry 4.0 and Applications - Assignment 2
Part 1: Process mapping and data collection
1. Find a process in your day-to-day life and simul8 it on Simul8
a. Can be any process with more than 5 steps, for example:
i. Ordering Food at Starbucks –
• Arrive, Look at Menu, Order at counter, Payment, Food preparation, Drink preparation, Collect Order.
ii. Cooking a dish –
• Prepare ingredients, heat up pan, add condiments, cook ingredients in order, dish up
iii. Work related production process (3D Printing) –
• Prepare 3d Model, Slice 3D model, clean build plate, calibrate machine 0, run print, remove build, post- processing
iv. Any other process you can find on YouTube will do as well
2. Imagine you must do this for 1 week straight for 8 hours a day excluding weekends
3. Simulate the process in Simul8, do the following and answer the following questions
a. Chart the process flow chart
b. Find out how many people and how much equipment is needed to ensure a balanced production flow i.e. OEE above 75% for all steps
c. Find out how much items can you produce in this state
d. Come up with a table showing the OEE for all your steps at each stage
|
Step |
Input |
Output |
Availability |
Performance |
Quality |
OEE |
|
Receiving |
- |
10/hr |
90% |
93% |
80% |
66.96% |
|
… |
… |
… |
… |
… |
… |
… |
|
… |
… |
…. |
… |
… |
… |
… |
Part 2: Dashboarding
Looking at the table you have made in part 1, you can see that it is a little hard to differentiate the different statistics. In a real-world factory, there are many more items to track in terms of production. These terms can be found in the OEE formular we have seen before.
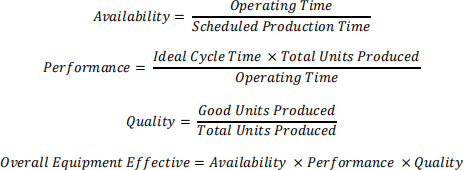
From these formulars we can see what are the major factors that influence OEE and their components:
1. Ideal Cycle Time – Takt Time, Equipment operation cycle time
2. Good Units Produced – Process Yield
3. Scheduled Production Time
4. Total Units Produced
5. Operating Time
These data can be challenging to display all at once for operators or managers to deal with production monitoring. These data is recorded into a database and we can arrange the data into a dashboard for easy monitoring. This is a major component of data visualization in Production
There is many software that can be used to do Dashboarding for example, Microsoft PowerBI, Tableu, Looker from Google Cloud, or Grafana.
Your Task for part 2 of Assignment 2 is to put yourself in the shoes of a production manager
1. Create a dashboard designed to display the data from the following tables that can help you monitor the production processes
2. The dashboard can be interactive or static in nature for your design
3. Dashboard does not need to be live
4. Explain the thought process of designing the table in this way
|
Steps |
Running Status |
Current lot Number |
Material Used (KG) |
Waste Materials (KG) |
Current Lot Run Time (Hours) |
Expected Lot Run Time (Hours) |
|
Plate Grinding |
Running |
20005 |
- |
- |
1.3 |
1.5 |
|
Machine 1 |
Running |
20002 |
32.4 |
4.2 |
20 |
30 |
|
Machine 2 |
Running |
20004 |
42.5 |
5.3 |
74 |
108 |
|
Machine 3 |
Stopped |
- |
- |
- |
- |
- |
|
Furnace |
Running |
19999 |
- |
- |
8 |
10 |
|
Wirecut |
Running |
20000 |
- |
- |
3 |
4 |
|
Machining |
Stopped |
- |
- |
- |
- |
- |
|
Dimension Measurement |
Running |
19998 |
- |
- |
1 |
3 |
|
Tensile Strength Measurement |
Running |
19998 |
- |
- |
0.5 |
1.0 |
|
Packing |
Running |
19997 |
- |
- |
1 |
1 |
|
Shipping |
Running |
19996 |
- |
- |
1 |
2 |
|
Steps |
Process Down time |
Failure Rate |
Units produced |
|
Plate Grinding |
8% |
5% |
1043 |
|
Machine 1 |
12% |
- |
205 |
|
Machine 2 |
40% |
- |
102 |
|
Machine 3 |
3% |
- |
733 |
|
Furnace |
4% |
- |
1037 |
|
Wirecut |
15% |
- |
1036 |
|
Machining |
20% |
4% |
1035 |
|
Dimension Measurement |
30% |
4% |
1034 |
|
Tensile Strength Measurement |
14% |
10% |
1034 |
|
Packing |
70% |
- |
1033 |
|
Shipping |
70% |
- |
1032 |
2025-09-24