PUBPOL 5210: Intermediate Microeconomics for Public Affairs
Hello, dear friend, you can consult us at any time if you have any questions, add WeChat: daixieit
PUBPOL 5210: Intermediate Microeconomics for Public Affairs
Problem Set 1: Indifference Curves and Budget Sets (170 points) Solutions
MULTIPLE CHOICE (3 points each)
1) If the consumer’s budget constraint is given by 10�� + 5�� = 100 where �� is food and �� is shelter, how much food can he buy if he purchases 2 units of shelter?
a) 10
b) 5
c) 20
d) 9
e) None of the above
2) Krystal likes cashew nuts better than almonds and likes almonds better than walnuts. She likes pecans equally well as macadamia nuts and prefers macadamia nuts to almonds. Assuming her preferences are transitive
a) walnuts are preferred to pecans
b) pecans are preferred to walnuts
c) walnuts are preferred to cashews
d) cannot determine whether pecans are preferred or not to walnuts
3) If a consumer is willing to give up 3 units of food (vertical axis) in exchange for one unit of shelter (horizontal axis) and food is priced at 10 and shelter at 20, then the consumer is:
a) purchasing too much food for utility maximization
b) purchasing too much shelter for utility maximization
c) purchasing just the right amount of each good for utility maximization
d) purchasing less than the budget would allow
4) In spending all her money on wine and cheese, Lashawn finds that her marginal utility of the last bottle of wine is 6 and her marginal utility of the last pound of cheese is 5. The price of a bottle of wine is $4 (drinks very cheap wine) and the price of a pound of cheese is $4. If she maximizes utility subject to her budget constraint which of the following should she do:
a) More wine and less cheese
b) Less wine and more cheese
c) Keep consumption the same since she is consuming the optimal bundle
d) There is not enough information to determine her optimal bundle
e) More wine and more cheese
f)
5) At market basket b, in the diagram below we can say
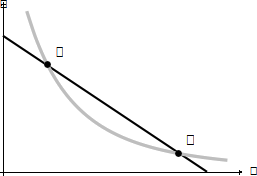
a) that ������/���� > ������/����
b) that ������/���� < ������/����
c) that ������/���� = ������/����
d) cannot determine the relationship between ������/���� and ������/����
PROBLEM SOLVING
6) The cast of an old famous show (Gilligan’s Island) decided to compete on the modern-day show Survivor. There are 5 people: the person that played Gilligan, Maryann, the Professor (no one knows his first or last name), Ginger, and the Skipper (no one knows his name either). They are put on an island where there are only two food items: mangos and coconuts.
• Gilligan likes both mangos and coconuts but has a strong preference for mangos
• Maryann likes both mangos and coconuts but has a strong preference for coconuts
• The Skipper likes coconuts but assigns no value to mangos
• Ginger likes mangos but assigns no value to coconuts.
• The Professor likes both mangos and coconuts and is always willing to give up one mango to get 4 coconuts.
For each of the following, draw a graph and make sure you label the vertical and horizontal axis. (5 points each)
(a) On the same graph draw the indifference curve for Maryann and Gilligan
(b) On a different graph draw the indifference curves for the Skipper, Ginger and the Professor.
7) Samantha takes her kids to a carnival with $50 and intends to spend the money on tickets for rides and food. When she arrives at the carnival, she sees that the price for a ride is $5 and the price for all food items is $10. She also learns that the first two rides are free. The carnival owner does not know Samantha’s preferences for rides and hopes that the offer of free rides will result in Samantha paying for more rides than she would if the free ride offer did not exist (there are no additional costs to the owner from having more riders, so they benefit from having more paid rides).
(a) Graph Samantha’s indifference curves and budget line in a way that demonstrates that the free rides were a bad idea for the company. Put food on the vertical axis and the number of rides on the horizontal axis. Hint: graph Samantha’s budget set with and without the free rides and show optimal choices. (5 points)
(b) Show Samantha’s indifference curves and budget line in a way that would make the free rides a good idea for the company. (5 points)
8) NYSEG (the utility company that serves Ithaca) charges $0.10 per kilowatt-hour (kWh) for the first 1000 kWh of power purchased by a residential consumer each month, but only $0.05 per kWh for all additional kWh. For a residential customer with a monthly income of $400 graph the budget constraint for electric power and the composite good. (10 points)
9) You go to a carnival that sells hot dogs for $1 dollar each and tickets for rides. Each ride requires one ticket and you have $12 to spend on hot dogs and tickets. You go to buy tickets and you see the following setup where this is the only way to purchase tickets.
• Small ticket package: $3 for 3 tickets
• Medium ticket package: $4 for 5 tickets
• Large ticket package: $5 for 8 tickets
Graph the budget constraint between hot dogs and rides with hot dogs being on the vertical axis. Hint: the budget constraint is not a line but rather a discontinuous number of points. (10 points)
10) You are a public affairs consultant working for a non-profit whose mission is to reduce cigarette smoking rates by getting adult smokers to switch to e-cigarettes. In writing a strategic plan, you decide to use indifference curves and budget lines to demonstrate the outcomes of your intervention. In the introduction of your report, you make several key assumptions: First, you assume that e-cigarettes and cigarettes are substitutes for each other but not perfect substitutes. Second, you assume that a typical consumer has $4000 to spend on these two products per year and that regardless of your intervention, they will spend this amount of money on some combination of these goods. Third, you assume that the price of cigarettes and e-cigarettes are both priced at $10.
Your report is divided into two sections:
Section 1: Advertising Persuasion Approach
Your first strategy is focused on an information dissemination campaign focused on the relative health benefits of e-cigarettes relative to cigarettes. Section 1a of your report begins with a graph of indifference curves between cigarettes (y-axis) and e-cigarettes (x-axis) and shows the initial choice of a consumer who chooses to expend all $4000 on cigarettes.
a) Draw this graph clearly labeling the y-axis, the x-axis, a family of indifference curves, the budget line, the intercepts of the budget line and the resulting choice by the consumer. Describe in words the initial situation and what it is about the indifference curves relative to the budget line that results in the consumer spending all of the $4000 on cigarettes. (10 points)
b) Your report then shows the successful impact of your information campaign in one particular community where, after the intervention, the typical consumer now spends the $4000 on e- cigarettes instead of cigarettes.
Draw this graph, clearly labeling the y-axis, the x-axis, the budget line, the family of indifference curves and choice prior to the information campaign, and the family of indifference curves and consumer choice after the campaign. (10 points)
c) Now suppose the result of your information campaign led the consumer to spend half of the $4000 on cigarettes and half on e-cigarettes.
Draw this graph, clearly labeling the y-axis, the x-axis, the budget line, the intercepts of the budget line, the family of indifference curves and choice prior to the information campaign, and the family of indifference curves and consumer choice after the campaign. (10 points)
Section 2: Taxation
Instead of focusing on advertising and preferences, the second part of your report talks about taxes on cigarettes. As part of your consulting contract, you convince the federal government to impose a $10 dollar per pack tax only on cigarettes. The result of the tax increase moves most of the person’s consumption from cigarettes to e-cigarettes (before the tax they spent all their income on cigarettes). Again, you decide the best way to present the impact of this intervention is to show a graph with the initial choice and the choice after the tax increase.
d) Draw this graph, clearly labeling the y-axis, the x-axis, the original budget line and the post- tax budget line (including the intercepts with the axis), the family of indifference curves, the optimal consumer choice prior to the tax increase and the choice after the tax increase. (10 points)
e) Now suppose that the government was concerned about the income impact of the tax on cigarettes and provides an income subsidy to people. On the graph, show the income subsidy necessary to get the consumer back to their original utility level. In the graph label the income and substitution effects. (10 points)
11) The government is concerned that rent takes up so much of a low-income family’s monthly budget. In order to subsidize low-income housing, a policy is implemented where the government will pay 1/2 of the rent (which they send to the landlord). So, for example, if a family chose to rent an apartment that costs $800 a month, the government would pay $400 directly to the landlord, and the family would pay $400 from their budget. The Cunningham family, who lives in Milwaukee have an income of $1,000 a month and qualify for this subsidy. Knowing they have to pay only half, they optimally choose an apartment to rent listed at $500 a month.
a) On a diagram, draw the budget set and indifference curves of the Cunningham family (with dollars per month of other goods consumed on the vertical axis and dollars of housing per month on the horizontal axis (use the listed rent for the horizontal axis, not the amount the consumer pays). Show the consumer’s choice. Label all relevant points including the vertical and horizontal intercepts of the budget set and the chosen level of housing (the listed rent of housing) and other goods consumed. (10 points)
b) Now assume a new policy has been proposed that instead of paying for half the price of the rent the government provides each low-income household with a housing voucher worth
$250 a month. The voucher can be used only for housing expenditures (and is non-tradeable). Technically, if the family chose to rent the same $500 apartment, they would simply hand over the voucher and have to pay $250 to the landlord (who would then collect the $250 from the government by sending in the voucher). Draw a diagram showing the budget set under this housing voucher policy. Be sure to label all relevant points including the horizontal intercept and the vertical intercept. Use the same x-axis and y-axis as in (a). (10 points)
c) On the same graph include both budget sets from (a) and (b). Now add indifference curves
to the graph to show the choice made under the housing voucher policy. Based on your drawing explain whether you think the Cunningham family would prefer the 1/2 off policy or the housing voucher policy. Can you draw indifference curves such that you might change your answer as to which policy they prefer? (10 points)
12) In recent years there has been a heated debate about public versus private elementary education. Suppose the Jones family has an income of $200,000 and can purchase units of quality of education at a price of $10,000 per quality unit at private schools. Suppose the Jones family lives in an area where all families pay a property school tax of $10,000, and their child can attend the public school at no charge. Assume that the public school provides one unit of education quality and no more than that. Of course, the Jones family must pay this tax whether they send their kid to public or private school. The Jones family has the option to purchase higher amounts of quality (more than one unit) at private schools and the price per unit of quality at private schools is $10,000. All families are required by law to provide their children with at least 1 unit of education quality, either through private or public schools.
a) Draw the budget constraint for the Jones family with number of quality education units on the horizontal axis and dollar expenditures on other goods on the vertical axis. Be sure to label all important points on the budget constraint. (5 points)
b) In a new graph, re-graph the budget constraint you derived in part (a) and add indifference curves that would lead a family to choose the one unit of public education. (5 points)
c) In a new graph, re-graph the budget constraint you derived in part (a) and add indifference curves that would lead a family to choose private education. (5 points)
2025-09-20