Econ 421 Assignment 1: Ricardian model & Specific-factor model
Hello, dear friend, you can consult us at any time if you have any questions, add WeChat: daixieit
Econ 421 Assignment 1: Ricardian model & Specific-factor model
1. (50 points) The Ricardian Model
Consider a Ricardian model with two countries (Home and Foreign) and two goods (apple and shirts). Labor is the only input. Home has production functions of the form:

where Ya is the output of apple, measured in pounds, Yw the output of shirts, measure in pieces. La and Ls are units of labour employed in apple or shirt production. Similarly, Foreign has production functions:

Home has a total of 300 units of labour, and Foreign has a total of 600 units of labour. We also know that Home and Foreign country consumers have the same utility function:

(a) (5 points) In no-trade equilibrium, what are the relative prices of apples in Home and in Foreign? Which product will Home export?
(b) (10 points) What is the equilibrium consumption bundle at Home and Foreign, respectively, in the autarky equilibrium?
(c) (5 points) What are the equilibrium units of apple and shirts produced at Home in the autarky equilibrium?
(d) (10 points) Suppose now Home and Foreign open up for free-trade. Derive the relative demand curve for apples. Solve for the equilibrium relative price of apples in the free-trade equilibrium.
(e) (5 points) What are the equilibrium units of apple and shirts produced at Home in the free-trade equilibrium?
(f) (5 points) What is the equilibrium consumption bundle at Home and Foreign, respectively, in the free-trade equilibrium?
(g) (10 points) Draw the World relative supply and demand diagram for apples. Label the free trade equilibrium.
2. (30 points) Specific-factors Model
Suppose that when the Home country opens up to trade, the price of the M good relative to the A good decreases. In our class, we assume that this relative price increases.
(a) (5 points) Draw a figure to show the production and consumption choices of the Home country.
(b) (5 points) Which good is exported and which good imported? Why?
(c) (5 points) How does the opportunity cost of the M good change, going from closed economy to free trade? Why?
(d) (5 points) Are capital owners better-off or worse-off? Explain.
(e) (5 points) How does the purchase power (real wage in terms of both M and A goods) of workers change? Explain.
(f) (5 points) Explain why the overall gains from trade are still positive.
3. (20 points) In this problem you will use the World Development Indicators (WDI) database from the World Bank to compute the comparative advantage of two countries in the major sectors of gross domestic product (GDP): agriculture, industry (which includes manufacturing, mining, construction, electricity, and gas), and services. Go to the WDI website at https://datatopics.worldbank.org/ world-development-indicators/, and scroll down to “Data Themes” section where you will be using the sections on “People” and on the “Economy.”
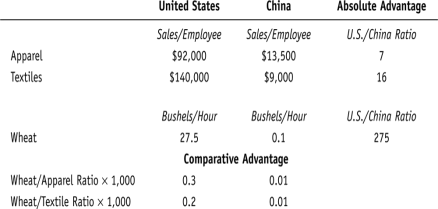
Figure 1: Example
(a) (5 points) In the “People” section, start with the table “Labor force structure.” Choose two coun-tries that you would like to compare, and for a recent year write down their total labor force (in millions) and the percentage of the labor force that is female. Then calculate the number of the labor force (in millions) who are male and the number who are female.
(b) (5 points) Again using the “People” section of the WDI, now go to the “Employment by sector” table. For the same two countries that you chose in part (a) and for roughly the same year, write down the percent of male employment and the percent of female employment in each of the three sectors of GDP: agriculture, industry, and services. (If the data are missing in this table for the countries that you chose in part (a), use different countries.) Use these percentages along with your answer to part (a) to calculate the number of male workers and the number of female workers in each sector. Add together the number of male and female workers to get the total labor force in each sector.
(c) (5 points) In the “Economy” section, go to the table “Structure of output.” There you will find GDP (in $ billions) and the % of GDP in each of the three sectors: agriculture, industry, and services. For the same two countries and the same year that you chose in part (a), write down their GDP (in $ billions) and the percentage of their GDP accounted for by agriculture, by industry, and by services. Multiply GDP by the percentages to obtain the dollar amount of GDP coming from each of these sectors, which is interpreted as the value-added in each sector, that is, the dollar amount that is sold in each sector minus the cost of materials (not including the cost of labor or capital) used in production.
(d) (5 points) Using your results from parts (b) and (c), divide the GDP from each sector by the labor force in each sector to obtain the value-added per worker in each sector. Arrange these numbers in the same way as the “Sales/Employee” and “Bushels/Worker” shown in Figure 1. Then compute the absolute advantage of one country relative to the other in each sector, as shown on the right-hand side of Figure 1. Interpret your results. Also compute the comparative advantage of agriculture/industry and agriculture/services (in the same way as shown in the bottom of Figure 1) and the comparative advantage of industry/services.
Base on your results, what should be the trade pattern of these two countries if they were only trading with each other?
2025-09-19