BIOC 334 & BIOC 434 X-ray Crystallography homework
Hello, dear friend, you can consult us at any time if you have any questions, add WeChat: daixieit
BIOC 334 & BIOC 434
X-ray Crystallography homework (YEE)
Due 11:50 p.m. Thursday, October 10
For this homework assignment, you will need to use:
- the X-ray crystallography software package Phenix
- the interactive graphics program Coot/WinCoot.
Please edit this Word file to complete your homework assignment:
a) Print Page 3 with Figure 1 to make physical measurements (i.e. do not measure on your monitor)
b) Add your name to the header above
c) Insert your answers after each question below, in bold or colored font, to be easily distinguished
d) Part marks may be given for some answers if it’s clear that you used the correct approach but made a minor calculation error; this is only possible if you include your calculations and reasoning in your answer
Question 1: Use Figure 1 to answer all parts of Question 1
Bragg’s Law describes the conditions for constructive interference that in X-ray crystallography lead to measurable diffraction spots: 2dsinq = nl
One can calculate the repeating distances in the crystal by measuring the spaces between spots in the diffraction pattern, using a modified version of Bragg’s Law: d = l / [2sin([tan-1(d*/R)]/2)]
where d = the distance in the crystal that is being calculated
λ = wavelength of X-rays used
d* = distance between adjacent lattice points in the diffraction pattern (measured)
R = distance between crystal & detector
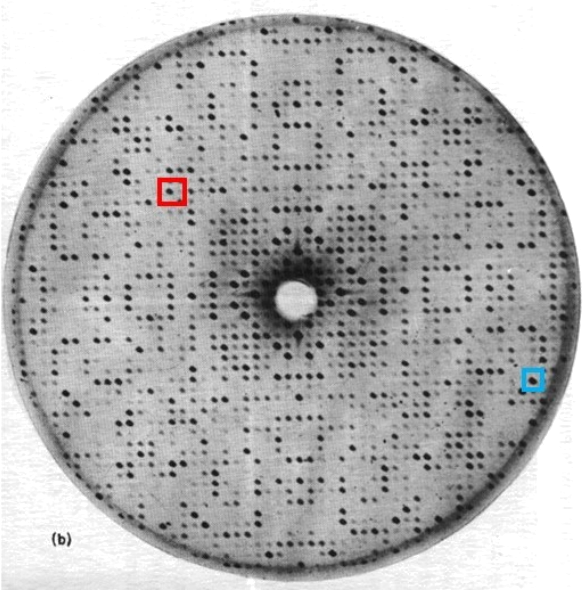
Figure 1 shows a single 2D slice of a 3D diffraction pattern. The wavelength used is 0.98 Å and the distance between the crystal and detector is 13.7 cm. Please print a paper copy of Figure 1 and this information, along with the modified Bragg’s Law above, to answer the following questions.
1.1) What symmetry and symmetry axes do you see in this diffraction pattern? Please identify by specifying the type of symmetry (e.g. 3-fold rotation symmetry) and the direction of the axis (e.g. 3-fold rotation symmetry along the horizontal axis).
1.2) The diffraction pattern can be described as a 3D lattice with spots at lattice points of varying intensity. Measure the distance between adjacent lattice points along the horizontal axis? (i.e. give answer with 2 significant figures)
1.3) Using Bragg’s Law to calculate, what is the repeat distance in the crystal that gives rise to the lattice spacing between diffraction spots along the horizontal axis? (calculate to at least 2 significant figures)
1.4) Similarly, what is the lattice spacing between diffraction spots along the vertical axis? What is the repeat distance in the crystal that gives rise to this lattice spacing?
1.5) Assume that the 2 crystal repeat distances calculated in 3) and 4) correspond to the lengths of two of the crystal’s unit cell axes. Also assume that the angle between the 2 axes measured in the diffraction pattern is the same as the angle between the two unit cell axes calculated in 1.3) and 1.4). Which of the 7 unit cell shapes is/are most likely for the crystal that gave rise to this diffraction pattern?
1.6) Explain your reasoning for your answer to 1.5).
1.7) Can the length of the third unit cell axis be calculated using the information given? Why or why not?
1.8) What is the resolution of the diffraction spot highlighted in the blue square in Figure 1? What is the resolution of the diffraction spot in the red square? Which of the two is the highest resolution diffraction spot?
Question 2: Use the computer software programs Phenix and Coot/WinCoot, and the files “structure_bad.pdb” and “maps.mtz” (available in Canvas) to answer all parts of Question 2.
Phenix is an interactive software suite used for X-ray crystallography (and now also cryo EM) to solve and refine structures. You will be using this software to refine a structure with options to one to view electron density maps and structures, and to alter conformations in structures so that they will fit the electron density maps better.
2.1) Download 2 files from Canvas: protein_bad.pdb and phases.mtz.
2.2) In Coot, open coordinates with the protein_bad.pdb file and auto open mtz with the phases.mtz file. You should see both a structure and electron density maps. There are 2 maps displayed: display only the first/top map (blue) that has “FWT PHWT” in its name. Display the structure so that you can easily distinguish between the different polypeptide chains.
2.3) This is the crystal structure of the CoV-2 spike protein ligand binding domain bound to the human ACE2 receptor. The side chains of 3 amino acids in the spike protein and 4 amino acids in the ACE2 receptor that form interactions across the binding interface have been moved out of electron density and are in the wrong conformation.
Give the names and residue numbers for these 7 amino acids that are in the wrong conformation and out of electron density.
For each of the 3 amino acids in the spike protein that are in the wrong conformation
a) try to fit the side chain properly into its electron density by changing its side chain conformation. Do this by first centering on the amino acid and then using the “Edit chi angles” menu command to adjust the side chain torsion angles so that the residue fits well into the electron density.
b) identify the nearby ACE2 receptor amino acid(s) that is/are also in a wrong conformation and try to fit its side chain into its electron density by centering on it and using “Edit chi angles”.
For each of the 3 spike protein amino acid, snapshot a closeup view of how its side chain fits into the electron density after you fix its side chain conformation, and paste the three snapshots below. Please add a label for each of the amino acids with its name and residue number.
2.4) Use Phenix to refine this structure. In Phenix under “Refinement”, choose “phenix.refine” and add the protein_bad.pdb file. You should see that the space group and unit cell dimensions are extracted and fill their respective windows. Add the phases.mtz file. You should see that the data labels window is now filled. Use the default parameters to run 3 cycles of model refinement by clicking on “Run” and “Run now” at the top of the window.
What are the starting values of R-work and R-free before refinement? What are their final values after refinement? What do the changes in R-work and R-free indicate?
What are the starting values of rmsd for bonds and angles? What are their final values? What do the final values indicate? What do the changes after refinement in these two rmsd values indicate?
2.5) Open the pdb file created by Phenix at the end of refinement in Coot and check the side chains of the 7 amino acids you identified in 2.3) . Have their side chain torsion angles been refined so that the side chains fit into the electron density better?
The 3 amino acids in the spike protein domain and 4 amino acids in the ACE2 that were originally in the wrong conformation and out of density form interactions with each other. For each of the 3 spike protein amino acid, which of the 4 ACE2 residue(s) interact with it? Give the names and residue numbers for the spike protein – ACE2 interacting pairs. What type of interaction does each pair of spike protein-ACE2 amino acids form?
Figure 1
2025-07-09