Assignment 1
Hello, dear friend, you can consult us at any time if you have any questions, add WeChat: daixieit
Assignment 1
Description
This assignment is based on the section “Data Behind the Charts” . Questions 1 – 7 are based on the dataset corporate_reputation_wide.csv. It is best to do the first seven questions in order as the dataset modified in the first question is what you will use for later questions. Question 8 – 10 have their own datasets.
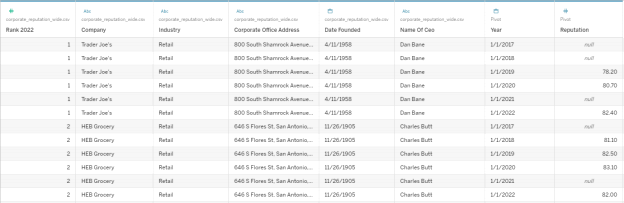
1. Read the dataset corporate_reputation_wide.csv into Tableau. Pivot the data to make it a tall (rather than wide) format. Next, clean the data to remove the prefix, year_ in front of the year and hide irrelevant column, “change”. Convert reputation scores to number and year to data format. Once this process is done, the first few rows of data in Data Source View should look like the figure below.
In many of the following exercises, you are being asked to generate a horizontal bar chart. In class, I illustrated a few of these with a Table. To make a basic horizontal chart (which is all that is being asked of you here), place the Dimension on Rows and the Measure on Columns.
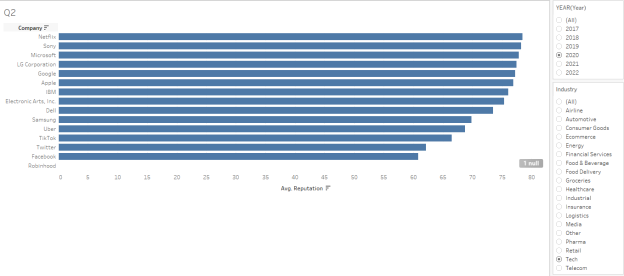
2. Construct a Horizontal Bar Chart of Reputation by Company with an interactive filter for Year and Industry. The interactive filter should be a single value list so that selecting Year/Industry only displays data for the corresponding Year/Industry. Sort the companies in descending order of Reputation. Resulting chart should resemble illustration below.
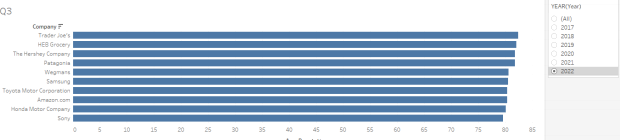
3. Construct a Horizontal Bar Chart of Reputation by Company with an interactive filter for Year. The interactive filter should be a single value list so that selecting a year only displays data for the corresponding year. Sort the companies in descending order of Reputation. Only display the Top 10 by reputation for the selected year (not across all years). Thus, the top 10 companies for each year are likely to be different. Resulting chart should resemble illustration below.
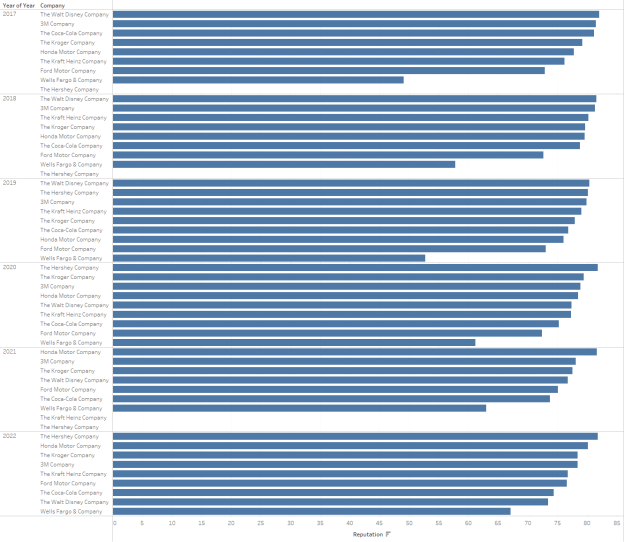
4. Construct a Horizontal Bar Chart of Reputation by Company for each Year. Filter the
data to only include companies that include the word “Company” in the name. Next, sort Company by Reputation so that the order of Company is based only on Reputation in that Year (not for all Years). Resulting chart should resemble illustration below.
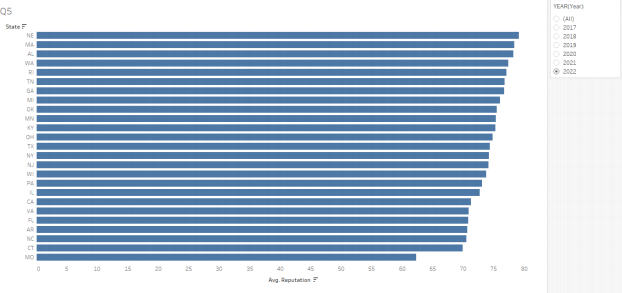
5. Extract State from the Corporate Office Address using regular expression. In Tableau,
you can do this with the function: REGEXP_EXTRACT. There are several different regular expressions that may be used. You can either construct one of your own or use the following: '.*([A-Z]{2}).\d*$'
Construct a Horizontal Bar Chart to compare each state in the US by average reputation. Use a Filter to remove all non-US states. Construct an Interactive Filter for Year such that selecting a year only displays data for the corresponding year. Sort the States in Descending order of Reputation. Resulting chart should resemble illustration below.
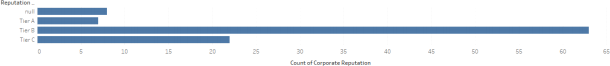
6. If-then-else transformation: Corporate reputation is measured as a numeric score. Convert Corporate Reputation into a categorical variable with three tiers such that
a. Reputation < 70 is Tier C
b. Reputation <80 but greater than or equal to 70 is Tier B
c. Reputation >=80 is Tier A
Construct a Horizontal Bar Chart to represent the number of companies in each Reputation Tier for the year 2020. To represent number of companies, you can use the generated field under measures. Resulting chart should resemble illustration below.
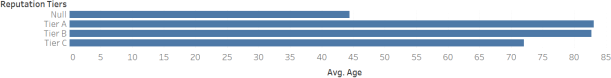
7. Determine the age of each company in years by computing the difference between “Date Founded” and today’s date. Use July 1, 2024 for today’s date. Construct a bar chart to compare average age for each Tier constructed in the previous question.
Resulting chart should resemble illustration below.
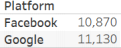
8. The dataset, digital_marketing_data.csv, contains data on clicks generated from
Facebook ads and Google ads for the months January, February and March. Reshape the data into a tall data structure with the following columns: Campaign ID, Month, Platform, and Clicks. Hide irrelevant columns. The resulting data frame should have 18 rows and 4 columns. Construct a table to summarize the total clicks (i.e., sum clicks) for each Platform. Resulting table should resemble illustration below.
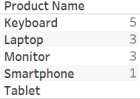
9. You have two datasets: products (products.csv) and sales (sales.csv). The products
dataset contains information about products, and the sales dataset contains information about the sales transactions. Your task is to construct a full outer join between tables to create a comprehensive view of sales data. Next, construct a table to summarize the total quantity (i.e., sum) for each Product Name. Resulting table should resemble illustration below.
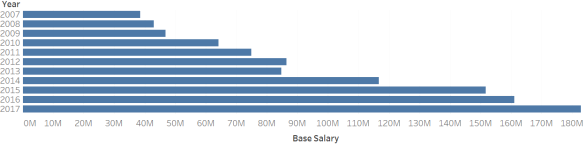
10. The files on us-major-league-soccer-salaries contains a set of text files that include
Major League Soccer Salaries for the years 2007 to 2017. Combine all the files into a single table by doing a Union. Next, construct a horizontal bar chart to compare Base Salary (Sum) for the years 2007 to 2017. (Hint: You will need to extract the year from the table containing data on all years). Resulting chart should resemble illustration below.
Submission Guidelines
1. Save the Tableau file as a “Tableau Packaged Workbook.” File → Save As and then
change file format to “Tableau Packaged Workbook”. The resulting file should have an extension .twbx.
2. Submit the Tableau Packaged Workbook.
2025-07-01