EC220/EC221 Introduction to Econometrics/Principles of Econometrics A Guide to the Specimen Exam Questions
Hello, dear friend, you can consult us at any time if you have any questions, add WeChat: daixieit
EC220/EC221
Introduction to Econometrics/Principles of Econometrics
A Guide to the Specimen Exam Questions
1 The London School of Econometrics (LSM) plans to introduce an additional remedial math course to its first-year students. Initially, the course is offered to and taken by all students whose birthdays fall on the 1st to the 15th of a month. At the end of the first academic year, LSM wants to examine whether the new math course improves the overall first year results. To this end, an analyst runs the following regression:

where Extra Course ![]() is a dummy (binary) variable taking a value of 1 if the student took the extra course, and 0 if they did not. The analyst also collects information on each student’s high-school PE (physical education) performance (PE Performance
is a dummy (binary) variable taking a value of 1 if the student took the extra course, and 0 if they did not. The analyst also collects information on each student’s high-school PE (physical education) performance (PE Performance ![]() ) and the number of hours spent on extracurricular activities (
) and the number of hours spent on extracurricular activities (![]()
![]()
![]()
![]()
![]()
![]()
![]()
![]()
![]()
![]()
![]()
![]() ) during the first year.
) during the first year.
a) (5 marks) What is the interpretation of ![]() ?
?
Answer. ![]() is the average aggregate first year mark for students not taking the remedial course and having a zero A-level score.
is the average aggregate first year mark for students not taking the remedial course and having a zero A-level score.
b) (10 marks) What do you expect the value of the coefficient ![]() 1 to be in the following regression and why?
1 to be in the following regression and why?

Answer. Participation in the remedial course is assigned by birthday, so it should be as good as random. As a result, A-level scores should be independent of participation and ![]() 1 should be zero. This is a balancing regression to check for successful randomisation. (Because
1 should be zero. This is a balancing regression to check for successful randomisation. (Because ![]() 1 is a dummy variable, this is equivalent to comparing the means of aggregate A-level scores of those who enrolled in the math course and those who didn’t – we should expect an insignificant difference).
1 is a dummy variable, this is equivalent to comparing the means of aggregate A-level scores of those who enrolled in the math course and those who didn’t – we should expect an insignificant difference).
c) (15 marks) Do you agree with the regression specification (1) to investigate the causal effect of attending the remedial math course on the first-year aggregate performance or would you specify the regression differently? Particularly, would you drop the variable Aggregate A level score ![]() or add any other variables to Equation (1)? Explain why?
or add any other variables to Equation (1)? Explain why?
Answer. The regression with the A-level score included or excluded would not suffer from OVB. If ![]() 1 = 0 in (b) then adding the A-level score in the first-year mark regression wouldn’t matter for
1 = 0 in (b) then adding the A-level score in the first-year mark regression wouldn’t matter for ![]() (OVB is
(OVB is ![]()
![]() 1 = 0). If
1 = 0). If ![]() 1 is non-zero, we would be worried that randomisation failed and wouldn’t want to interpret
1 is non-zero, we would be worried that randomisation failed and wouldn’t want to interpret ![]() causally in either case. Adding the A-level score in the first-year mark regression is still helpful because it is likely a strong predictor of first year’s mark. If so, including the covariate will reduce the standard error of
causally in either case. Adding the A-level score in the first-year mark regression is still helpful because it is likely a strong predictor of first year’s mark. If so, including the covariate will reduce the standard error of ![]() . Aggregate A level score
. Aggregate A level score ![]() is not a bad control and, at worst, a covariate that is potentially helpful to improve the precision of the estimate. (
is not a bad control and, at worst, a covariate that is potentially helpful to improve the precision of the estimate. (![]()
![]()
![]()
![]()
![]()
![]()
![]()
![]()
![]()
![]()
![]()
![]() ) can be a bad control (It might be affected by attending a course), and PE Performance
) can be a bad control (It might be affected by attending a course), and PE Performance ![]() is another covariate that could help improve precision.
is another covariate that could help improve precision.
d) (10 marks) How would the result from the regression (2) in (b) affect your decision whether to interpret ![]() as the causal effect of the math course?
as the causal effect of the math course?
Answer: If ![]() 1 = 0 in (b) then we are more confident that our randomisation worked as intended. A more careful examination should involve checking balance for other observable characteristics. If
1 = 0 in (b) then we are more confident that our randomisation worked as intended. A more careful examination should involve checking balance for other observable characteristics. If ![]() 1 is
1 is
non-zero, we should be worried that randomisation failed and wouldn’t want to interpret ![]() causally, regardless of the control variables we use.
causally, regardless of the control variables we use.
e) (10 marks) The head of the LSM counselling service asks whether the remedial course particularly helps students entering with weaker academic credentials. How would you specify a regression to answer this question? Be precise and explain the interpretation of any relevant coefficient.
Answer. We want to include an independent variable for A-level scores, representing academic credentials in secondary school. There are two main methods to do this . In the first case, we create a dummy for A-level scores below a cut-off (we may name it Low) and augment our model with both the Low variable itself (main effect) and the interaction of Extra Course ![]() with Low. The coefficient on the interaction tells you the differential effect of the course on students with low A-level results (how much more the course helps a low A-level student compared to high A-level student). The second method is to keep the linear A-level variable and interact Extra Course
with Low. The coefficient on the interaction tells you the differential effect of the course on students with low A-level results (how much more the course helps a low A-level student compared to high A-level student). The second method is to keep the linear A-level variable and interact Extra Course ![]() with the linear A-level variable. We would add both the A-level variable and the interaction to the regression and look for a negative coefficient on the interaction term (students scoring higher in A-levels benefit less from the remedial course).
with the linear A-level variable. We would add both the A-level variable and the interaction to the regression and look for a negative coefficient on the interaction term (students scoring higher in A-levels benefit less from the remedial course).
![]()
![]() 2 The Ministry of Truth is interested in a rumour that regular social media use can affect academic performance. An analyst, Winston Smith, is tasked to do research on the effect of social media use. He conducts a survey of 19,840 university students aged 19 to 26, randomly chosen from 200 universities in the city Airstrip Two. The key variable for “social media use,”
2 The Ministry of Truth is interested in a rumour that regular social media use can affect academic performance. An analyst, Winston Smith, is tasked to do research on the effect of social media use. He conducts a survey of 19,840 university students aged 19 to 26, randomly chosen from 200 universities in the city Airstrip Two. The key variable for “social media use,” ![]()
![]()
![]()
![]()
![]()
![]()
![]()
![]()
![]()
![]()
![]() , is a dummy variable equal to 1 if the individual
, is a dummy variable equal to 1 if the individual ![]() has been using social media regularly over the past academic year. Running regressions with standardised academic performance,
has been using social media regularly over the past academic year. Running regressions with standardised academic performance, ![]()
![]()
![]()
![]()
![]()
![]()
![]()
![]()
![]()
![]()
![]()
![]()
![]()
![]()
![]()
![]()
![]() , on the left side, he obtains the following results:
, on the left side, he obtains the following results:
a) (10 marks) Give a story why regular social media use may have a positive causal effect on academic performance, and a different story why it may have a negative causal effect.
Answer: Positive effect: Regular social media use can be successfully used to improve teamwork, writing skills, and instant access to necessary information that’s not immediately available from the library or from teachers. Social media use can also help with creative tasks, such as generating and sharing ideas.
Negative effect: Regular social media use takes away time spent on studying/revising, hence impeding academic performance.
b) (15 marks) To push forward a new campaign on social media, a politician interprets the coefficient in Column (1) and claims that “the data were collected using a random sampling process so we could establish causality from Column (1). There is a positive causal effect of regular social media use on academic performance among university students”. Explain why the politician is wrong.
Answer. First, we should not interpret the coefficient in Column (1) as causal effect because there exists selection bias: students who choose to use social media regularly might be systematically different from those who don’t in ways that are related to the outcome. For example, those who work harder and have the ambition to improve their writing/communication skills may choose to use
Social Media more regularly. These students will also do better in exams because of their hard working and ambitious attitude (the confounder) (note, you may think this story is implausible, there are other stories by which this bias occurs, we are only giving one example) . If this is the case, we have an upward bias. Second, random sampling does not eliminate selection bias, random sampling means we will typically draw a representative sample of the population. But the selection into social media use happens in the whole population, and the selection bias remains in the sample. Therefore, the only thing we should claim is there is a positive correlation/association between regular social media use and academic performance. No causal claim should be made.
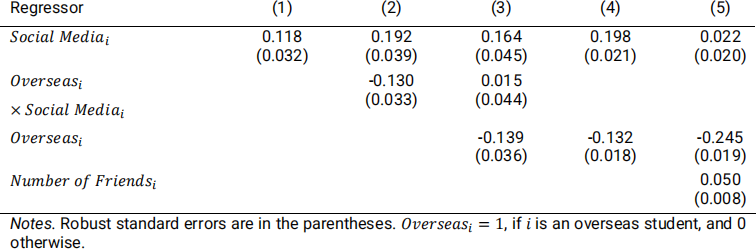
c) (10 marks) Julia, another analyst, reacts to these results and claims: “Column (2) says that students from overseas who regularly use social media have lower academic performance than overseas students who don’t.” Is she right or wrong? Explain why.
Answer. Column (2) contains an interaction of social media and overseas but does not include a main effect for students being from overseas and is therefore difficult to interpret. We should rather look at Column (3): 0.164 is the effect (association) of regular social media use for Home Students, and 0.164 + 0.015 = 0.179 is the effect (association) of regular social media use for overseas students. Overseas students who regularly use social media should have higher academic performance than overseas students who don’t. Julia is wrong.
d) (10 marks) How would you conduct a statistical test that social media use has no effect on academic performance of home students at the 5% significance level using column (3)? If you can, derive the result of this test from the information in the table. If you can’t, explain why.
Answer. We want to test if 0.164 is significantly different from zero. We can conduct a t-test using the robust standard error. We can calculate the t statistic as 0.164/0.045 =3.6 . Since the test statistic is larger than 2, there is a significant effect.
e) (5 marks) Do overseas students have more or fewer friends than home students do? Explain how you arrive at your answer.
Answer. Use the OVB formula. Comparing (4) and (5), the difference in the coefficients on
![]()
![]()
![]()
![]()
![]()
![]()
![]()
![]()
![]()
![]()
![]()
![]() in the short regression (4) minus the long regression (5) is
in the short regression (4) minus the long regression (5) is
- 0.132 – (- 0.245) > 0. This OVB is the product of the effect of ![]()
![]()
![]()
![]()
![]()
![]()
![]()
![]()
![]()
![]()
![]()
![]() on
on ![]()
![]()
![]()
![]()
![]()
![]()
![]()
![]()
![]()
![]()
![]()
![]()
![]()
![]()
![]()
![]()
![]() (0.050, from column (5)) and the effect of
(0.050, from column (5)) and the effect of ![]()
![]()
![]()
![]()
![]()
![]()
![]()
![]()
![]()
![]()
![]()
![]() on
on ![]()
![]()
![]()
![]()
![]()
![]()
![]() . We can infer that the regression of
. We can infer that the regression of ![]()
![]()
![]()
![]()
![]()
![]()
![]()
![]()
![]()
![]()
![]()
![]() on
on ![]()
![]()
![]()
![]()
![]()
![]()
![]() must also produce a positive coefficient, so overseas students have more friends than home students do in Airstrip Two.
must also produce a positive coefficient, so overseas students have more friends than home students do in Airstrip Two.
2022-01-04