EC220/EC221 Introduction to Econometrics/Principles of Econometrics Specimen Exams Questions
Hello, dear friend, you can consult us at any time if you have any questions, add WeChat: daixieit
EC220/EC221
Introduction to Econometrics/Principles of Econometrics
Specimen Exams Questions
1 The London School of Econometrics (LSM) plans to introduce an additional remedial math course to its first-year students. Initially, the course is offered to and taken by all students whose birthdays fall on the 1st to the 15th of a month. At the end of the first academic year, LSM wants to examine whether the new math course improves the overall first year results. To this end, an analyst runs the following regression:
Aggregate First Year Mark ![]() =
= ![]() +
+ ![]() Extra Course
Extra Course ![]() +
+ ![]() Aggregate A level score
Aggregate A level score ![]() +
+ ![]()
![]() (1)
(1)
where Extra Course ![]() is a dummy (binary) variable taking a value of 1 if the student took the extra course, and 0 if they did not. The analyst also collects information on each student’s high-school PE (physical education) performance (PE Performance
is a dummy (binary) variable taking a value of 1 if the student took the extra course, and 0 if they did not. The analyst also collects information on each student’s high-school PE (physical education) performance (PE Performance ![]() ) and the number of hours spent on extracurricular activities (
) and the number of hours spent on extracurricular activities (![]()
![]()
![]()
![]()
![]()
![]()
![]()
![]()
![]()
![]()
![]()
![]() ) during the first year.
) during the first year.
a) (5 marks) What is the interpretation of ![]() ?
?
b) (10 marks) What do you expect the value of the coefficient ![]() 1 to be in the following regression and why?
1 to be in the following regression and why?
Aggregate A level score ![]() =
= ![]() 0 +
0 + ![]() 1Extra Course
1Extra Course ![]() +
+ ![]() 2
2![]() (2)
(2)
c) (15 marks) Do you agree with the regression specification (1) to investigate the causal effect of attending the remedial math course on the first-year aggregate performance or would you specify the regression differently? Particularly, would you drop the variable Aggregate A level score ![]() or add any other variables to Equation (1)? Explain why?
or add any other variables to Equation (1)? Explain why?
d) (10 marks) How would the result from the regression (2) in (b) affect your decision whether to interpret ![]() as the causal effect of the math course?
as the causal effect of the math course?
e) (10 marks) The head of the LSM counselling service asks whether the remedial course particularly helps students entering with weaker academic credentials. How would you specify a regression to answer this question? Be precise and explain the interpretation of any relevant coefficient.
![]()
![]() 2 The Ministry of Truth is interested in a rumour that regular social media use can affect academic performance. An analyst, Winston Smith, is tasked to do research on the effect of social media use. He conducts a survey of 19,840 university students aged 19 to 26, randomly chosen from 200 universities in the city Airstrip Two. The key variable for “social media use”,
2 The Ministry of Truth is interested in a rumour that regular social media use can affect academic performance. An analyst, Winston Smith, is tasked to do research on the effect of social media use. He conducts a survey of 19,840 university students aged 19 to 26, randomly chosen from 200 universities in the city Airstrip Two. The key variable for “social media use”, ![]()
![]()
![]()
![]()
![]()
![]()
![]()
![]()
![]()
![]()
![]() , is a dummy
, is a dummy
variable equal to 1 if the individual ![]() has been using social media regularly over the past academic year. Running regressions with standardised academic performance,
has been using social media regularly over the past academic year. Running regressions with standardised academic performance, ![]()
![]()
![]()
![]()
![]()
![]()
![]()
![]()
![]()
![]()
![]()
![]()
![]()
![]()
![]()
![]()
![]() , on the
, on the
left side, he obtains the following results:
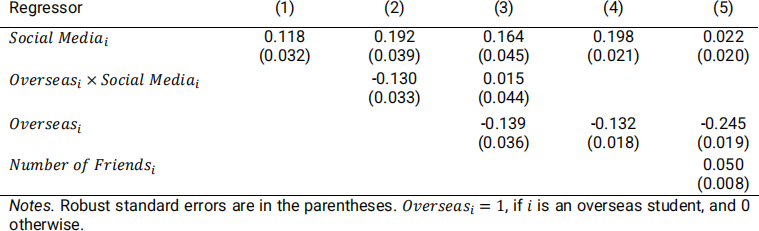
a) (10 marks) Give a story why regular social media use may have a positive causal effect on academic performance, and a different story why it may have a negative causal effect.
b) (15 marks) To push forward a new campaign on social media, a politician interprets the coefficient in Column (1) and claims that “the data were collected using a random sampling process so we can establish causality from Column (1). There is a positive causal effect of regular social media use on academic performance among university students”. Explain why the politician is wrong.
c) (10 marks) Julia, another analyst, reacts to these results and claims: “Column (2) says that students from overseas who regularly use social media have lower academic performance than those who don’t.” Is she right or wrong? Explain why.
d) (10 marks) How would you conduct a statistical test that social media use has no effect on academic performance of home students at the 5% significance level using column (3)? If you can, derive the result of this test from the information in the table. If you can’t, explain why. Note that the critical values for t-statistics are ![]() 0.05, ∞ = 1.645,
0.05, ∞ = 1.645, ![]() 0.025,∞ = 1.96,
0.025,∞ = 1.96, ![]() 0.01, ∞ = 2.326,
0.01, ∞ = 2.326, ![]() 0.005, ∞ = 2.576.
0.005, ∞ = 2.576.
e) (5 marks) Do overseas students have more or fewer friends than home students do? Explain how you arrive at your answer.
2022-01-04