ECON4003 Econometrics 1 Mock Exam
Hello, dear friend, you can consult us at any time if you have any questions, add WeChat: daixieit
Mock Exam
Econometrics 1, ECON4003
![]()
QUESTION 1
A researcher runs an experiment to measure the impact of a short nap on memory. There are 200 participants and they can take a short nap of either 60 minutes or 75 minutes. After waking up, each participant takes a short test for short-term recall. Each participant is randomly assigned one of the examination times, based on the flip of a coin.
Consider the following regression model:

where ![]()
![]()
![]()
![]()
![]() is the test score by the student
is the test score by the student ![]() ,
, ![]()
![]()
![]()
![]() is the amount of time for which the student slept prior to taking the test (
is the amount of time for which the student slept prior to taking the test (![]()
![]()
![]()
![]() = 60 or 75) and
= 60 or 75) and ![]()
![]() is the error term.
is the error term.
(a) Explain what the term ![]()
![]() represents. Why will different students have different values of
represents. Why will different students have different values of ![]()
![]() ? [Maximum 150 words]
? [Maximum 150 words]
(b) With reference to relevant OLS assumption(s), explain if the OLS estimators (![]() 0,
0, ![]() 1) are unbiased. [Maximum 350 words]
1) are unbiased. [Maximum 350 words]
(c) The researcher wants to test if that nap has no effect on test score at 1% significance level. Write down and explain all Stata codes required for this hypothesis test including the appropriate critical value . No calculation is needed. [Maximum 100 words]
(d) Suppose ![]()
![]() |
|![]()
![]()
![]() ~
~![]() (0,
(0, ![]() 2). Explain the factors that affect the variance of
2). Explain the factors that affect the variance of ![]() 1 . How can this variance be estimated? [Maximum 200 words]
1 . How can this variance be estimated? [Maximum 200 words]
(Total 50%)
QUESTION 2
A researcher collected a random sample of 100 individuals in the US who report their household income and savings . They estimate the following model:

where ln(![]()
![]()
![]()
![]() ) is the natural log of annual savings of household
) is the natural log of annual savings of household ![]() . ln (
. ln (![]()
![]()
![]() ) is the natural log of annual income of household
) is the natural log of annual income of household ![]() ,
, ![]()
![]()
![]()
![]()
![]()
![]()
![]() is the annual interest rate faced by household
is the annual interest rate faced by household ![]() , and
, and ![]()
![]() =
= ![]()
![]()
![]() .2
.2![]()
![]() is the error term of household
is the error term of household ![]() .
.
Assume that ![]()
![]() |
|![]()
![]() ~
~![]() (0,
(0, ![]()
![]() );
); ![]()
![]() and
and ![]()
![]()
![]() are independent.
are independent.
(a) Find ![]() (
(![]()
![]() |
|![]()
![]() ) and
) and ![]() (
(![]()
![]() |
|![]()
![]() ) . Show all your calculation steps clearly. (Maximum 150
) . Show all your calculation steps clearly. (Maximum 150
words)
(b) Explain whether the OLS estimator for ![]() 1 is the Best Linear Unbiased Estimator (BLUE).
1 is the Best Linear Unbiased Estimator (BLUE).
[Maximum 350 words]
(c) The researcher wants to estimate model (1). Write down and explain all Stata codes required for regression. No calculation is needed. [Maximum 100 words]
(d) The researcher constructs a scatterplot of annual savings on annual income. They find that the household with maximum annual savings looks like an outlier (see diagram below) .
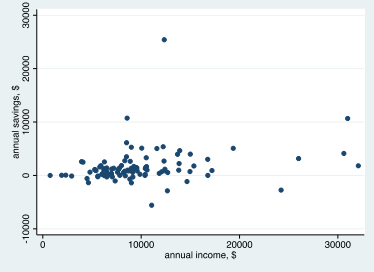
How would the inclusion of this household in the regression affect the OLS estimate for ![]() 1? [Maximum 200 words]
1? [Maximum 200 words]
(Total 50%)
QUESTION 3
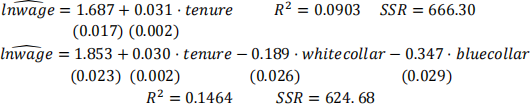
Consider a sample of 2,231 individuals who report their wages, tenure and occupation (blue collar, white collar or managerial). A researcher estimates a simple regression model ![]()
![]()
![]()
where ![]()
![]()
![]()
![]() is the log of wages;
is the log of wages; ![]()
![]()
![]()
![]()
![]() is the years of tenure
is the years of tenure ![]()
![]()
![]()
![]()
![]()
![]()
![]()
![]() is a dummy variable which equals to 1 if the individual is a blue-collar worker and 0 otherwise;
is a dummy variable which equals to 1 if the individual is a blue-collar worker and 0 otherwise; ![]() ℎ
ℎ![]()
![]()
![]()
![]()
![]()
![]()
![]() is a dummy variable which equals to 1 if the individual is a white-collar worker and 0 otherwise . Standard errors are in parenthesis below the coefficients.
is a dummy variable which equals to 1 if the individual is a white-collar worker and 0 otherwise . Standard errors are in parenthesis below the coefficients.
(a) Interpret the coefficient estimate for ![]() 1 and the
1 and the ![]() 2 in equation (2). [Maximum 100
2 in equation (2). [Maximum 100
words]
(b) Suppose you estimate equation (2) using Stata. What would happen to the estimates for
![]() 1 ,
1 , ![]() 2 and
2 and ![]() 3 if you included a dummy variable
3 if you included a dummy variable ![]()
![]()
![]()
![]()
![]()
![]() which equals to 1 if the individual is a manager and 0 otherwise? [Maximum 200 words]
which equals to 1 if the individual is a manager and 0 otherwise? [Maximum 200 words]
(c) Suggest one reason why the coefficient estimates for ![]()
![]()
![]()
![]()
![]() are similar in equations (1) and (2). [Maximum 100 words]
are similar in equations (1) and (2). [Maximum 100 words]
(d) Using the results in equation (2), test the hypothesis that ![]() 1 equals to 0.04 at 5% level of significance. State your conclusion. [Maximum 150 words]
1 equals to 0.04 at 5% level of significance. State your conclusion. [Maximum 150 words]
(e) Assuming that the error term is homoskedastic, test the hypothesis ![]() 2 =
2 = ![]() 3 = 0 at 5%
3 = 0 at 5%
level of significance . Explain the test procedure in detail and state your conclusion. [Maximum 250 words]
(Total 50%)
QUESTION 4
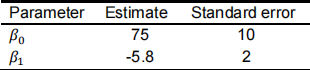
Using a sample of 200 students and the following model, we want to analyse the effect of class size on the students’ academic success.
The academic success variable (![]()
![]() ) is measured using a test score ranging from 0 (i.e. the poorest score) to 100 (highest score) and the class size (
) is measured using a test score ranging from 0 (i.e. the poorest score) to 100 (highest score) and the class size (![]()
![]() ) variable is a dummy variable
) variable is a dummy variable
equal to 1 for classes with more than 15 students and 0 otherwise.
We obtain the following estimation output:
(a) Provide an interpretation for the parameters ![]() 0 and
0 and ![]() 1 . Are the signs of these coefficients
1 . Are the signs of these coefficients
in line with your expectations? [Maximum 100 words]
(b) Calculate the 90 and 95 percent confidence intervals for ![]() 0 and
0 and ![]() 1 . [Maximum 200
1 . [Maximum 200
words]
(c) Is the estimated effect of class size on test scores statistically significant? Test this hypothesis at 5 percent significance level. [Maximum 200 words]
(d) Suppose that the true model should also include a binary variable which is equal to 1 if families show high effort for their children’s academic success and 0 if they show low effort. If this variable is negatively correlated with the class size, would omission of family effort variable lead to downward or upward bias for the estimate for ![]() 1? Show you calculations explicitly. [Maximum 300 words]
1? Show you calculations explicitly. [Maximum 300 words]
(Total 50%)
2021-12-20