CMPT 120 THE EVEN/ODD GRAPHICAL GAME
Hello, dear friend, you can consult us at any time if you have any questions, add WeChat: daixieit
CMPT 120, Fall 2021, Project
FINAL PROJECT: “THE EVEN/ODD GRAPHICAL GAME”

A. GENERAL PROJECTDESCRIPTION
READ THE WHOLE DOCUMENT BEFORE STARTING!!
Play the game in paper and pencil to get a good idea of how it unfolds!
(There is now an additional clarification in this description document, section H, See in red – Nov 16)
You are asked to implement a Python program, allowing the user to play the “Even/Odd Graphical Game” . This game can be played as a single player game (“SOLO” style) or two players where the user plays “against the computer” (“AI” style). The goal of the game is to change the values in an nxn board (n <10) so that in the final board, each and every row in the board adds up to an even number, AND each and every column in the board adds up to an odd number. (See winning board examples below and in sample runs). The program should give the option to the user to play several games. One game will consist of several turns, all turns within one game will be in the same style (all turns SOLO or all turns AI) based on the style the user chooses for the game. At the end of each game, the program presents the user’s overall score and a graph associated to some game statistics, and invites the user to play more games. At the end of all games, further totals and graphs are shown.
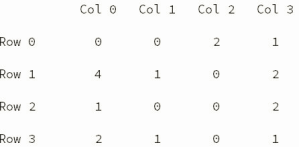
For each game, the program will create an initial board based on data from one of four provided files “boardX.csv”, where X is a number, 0, 1, 2 or 3. A board contains non negative integer numbers in each cell, organized as a square matrix of dimension 3x3, 4x4, etc., not larger than 10x10. See Figure 1.

Figure 1 – Example ofa 4x4 board. To simplify this document description, this board has all values less than 5, but this is NOT necessarily the case in general. A “pretty print” is shown here. The direct printing of a list ofrows with this data would be [[0,0,2,1],[4,1,0,2],[1,0,0,2],[2,1,0,1]].
You are provided with four possible initial board data files in comma-separated format. Each boardX.csv
file contains information to create one initial board. All boards are square: they have the same number of rows as columns. The user will be able to choose among these various boards for each game (by providing the number 0, 1, 2, or 3)1 .
The game unfolds as text based dialog with the user. At the end of each game, the program will show
some totals and graphs to the user (described below), and save the graphs as png files.
|
To draw the graphs you will have to use the matplotlib module. To be able to use this module (and therefore to develop this whole project) you can work with Replit, or with the environment “Spyder” (which you can download for free, to work locally). Both environments allow you to import matplotlib in your Python file without needing to install anything else. |
These graphs will be related to the game results that your program will calculate. See more details below. You should also check the sample runs provided, considered part of the problem description.
B. TOPICS THAT THIS PROJECTINCORPORATES
With this project, you will be working with:
![]() Reading text (csv) files
Reading text (csv) files
![]() Creating and manipulating one and two dimensional lists
Creating and manipulating one and two dimensional lists
![]() Working with single and nested loops
Working with single and nested loops
![]() Text interaction with the user
Text interaction with the user
![]() Exploring and using functions in the modules datetime and matplotlib
Exploring and using functions in the modules datetime and matplotlib
![]() Using the Spyder IDE (to work locally), or you can also use Replit
Using the Spyder IDE (to work locally), or you can also use Replit
![]() Plotting graphs based on the program data
Plotting graphs based on the program data
![]() Defining your own modules and functions, both productive and non-productive
Defining your own modules and functions, both productive and non-productive
C. DESCRIPTION OF THE GAME IN MORE DETAIL
You are highly recommended to implement this project in stages, first ensuring that the game works well in some basic way(s), before you incorporate additional features. Stage 1 next is a suggestion for you to start implement the game2 .
![]()
1 Note: You may create additional initial board files if that helps you debug your program. The project may be marked with different boards than those provided (but using the same file names and format as described here). Make sure that your program works with four possible board files, named and formatted as described here .
2 Note: You are also highly recommended to start by defining some functions and not implement them until later,
but at least preview what the functions would do and where they would be called from, initially just including a print inside the function definition, to allow you (as programmer) to follow the execution.
STAGE 1
To get started, we suggest implementing ONE (1) SOLO style game only (with several turns) following the sample runs dialog. At this stage, print the board directly printing the 2 dimensional list of rows (as in the caption in Figure 1). Leave for later to print the board in a formatted way, to include graphics, to validate the user input, and to implement playing many games.
ONE GAME: Ask the user the board number, 0, 1, 2 or 3 and then show the board. Each game has a maximum number of turns corresponding to (the integer part of) the number of cells on the board divided by 2; for example, there is a maximum of 4 turns in a 3x3=9 board. The user may choose to play fewer turns than the maximum allowed (see the sample runs).
Playing for each turn: the user selects a row and column position within the board, and then a value for that position between 0-50 (extremes included). (The row and column numbers need to be positive) . This value will substitute the previous value in that (row,col) position . If the user types 99 for the row, that indicates that the user does not want to play any more turns for this game. At this first stage assume the user types as asked, do not validate.
Winning one game: At the end of a game, if each and every row in the board adds up to an even number, AND each and every column in the board adds up to an odd number, then the user wins the game. See Fig 2. Otherwise, the user loses. If the user wins a game, the game points (described below) are added to the user’s total points. If the user loses the game, these points are subtracted.
a b
c d
Fig 2. This is a winning final board if a+b and c+d are both even, AND if a+c and b+d are both odd .
Points in one game: Points won (or lost) are calculated by adding up all the even numbers in the final board, divided by the number of turns that the user took for that game (taking the integer part).If the user ends the game by typing 99, that does not count as a turn.
What is informed at the end of one game: The game ends with the program informing if the user won (or lost) and the points won (or lost), the total points so far (considering all the games so far). A graph will illustrate some other values (as described below). (You should include the values represented in the graph as lists additionally to creating the graph). See the sample runs.
STAGE 2: AI STYLE GAME
The AI STYLE GAME incorporates that “the computer” has the opportunity to change one value per turn immediately after the user provides a value updating the board . (That is, the AI will play as many turns as the user plays). The “AI” strategy should only be to randomly choose any position (row, column) within the board, and change the board value in that position. The value should be a random value in the same range as the user is asked to type (0-50, extremes included). This AI ‘move’ may prevent the user from winning, but not necessarily – it is not really a very “intelligent” strategy.
The same calculation of points applies at the end of an ‘AI style’ game as when played with ‘SOLO’ style. That is, only the user is provided points (added points or subtracted), as explained above.
D. NEXT STAGES: ADDITIONAL FEATURES (some are for bonus points3)
Incorporate these features gradually (and test frequently!).
![]() Allow the user to play several games, calculating and showing overall totals when the user does not want to play more games.
Allow the user to play several games, calculating and showing overall totals when the user does not want to play more games.
![]() Show the board to the user in a tidier way, with row and columns titles as in the sample runs and some approximately equal separation between values within a row (as opposed to just printing the board as the list of lists of numbers)
Show the board to the user in a tidier way, with row and columns titles as in the sample runs and some approximately equal separation between values within a row (as opposed to just printing the board as the list of lists of numbers)
![]() Generate, show and save the graphs associated to each game, using functions in the module createGraphics (which you should import in main), and using matplotlib (see details below)
Generate, show and save the graphs associated to each game, using functions in the module createGraphics (which you should import in main), and using matplotlib (see details below)
![]() Include validation of the style of game that the user types (“SOLO” or “AI”) . It should not be case sensitive (i.e. ‘AI’ and ‘ai’ are both ok). If the user types the wrong word, ask again.
Include validation of the style of game that the user types (“SOLO” or “AI”) . It should not be case sensitive (i.e. ‘AI’ and ‘ai’ are both ok). If the user types the wrong word, ask again.
![]() BONUS POINTS: Include user validation of the row, column and board numbers making sure that they are integers and that they are within the adequate ranges, and ask the user to type again if incorrect. Recall that row number 99 indicates that the user wants to end the game, therefore it is a valid value for row.
BONUS POINTS: Include user validation of the row, column and board numbers making sure that they are integers and that they are within the adequate ranges, and ask the user to type again if incorrect. Recall that row number 99 indicates that the user wants to end the game, therefore it is a valid value for row.
![]() BONUS POINTS: Show a general graph at the end of all games (see next and sample runs)
BONUS POINTS: Show a general graph at the end of all games (see next and sample runs)
E. WHAT TO GRAPH
After one game is over
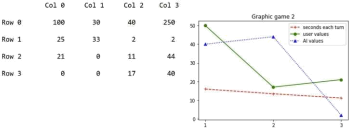
You need to plot two (if playing SOLO style) or three (if playing AI style) lines in one graph. One line will include points with the time (in seconds) that each turn lasted. Another line in the graphic will include the values (NOT the row/col positions) that the user typed for each turn. If playing AI style, the third line will include the values that the “AI” provided each turn (NOT the positions).
FOR BONUS POINTS: After all games are over, your program will plot one line superimposed over a histogram. The line will include one point per game with the seconds that each game took (i.e., total seconds of all turns within each game). Each bar in the histogram represents the total points the user got in each game (positive if the user won, negative otherwise). See sample runs.
F. TEXT FILES DESCRIPTION4
FILE boardX.csv (X = 0,1,2,3)
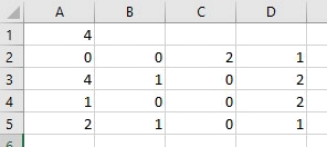
These files have one number in the first line: the board’s number of rows, which is the same as the number of columns. Then the file has one row per line (comma separated) with the numeric values. The board in Figure 1 above corresponds to the file in Figure 3 next.
![]()
3 These are bonus points within this project
4 Note again that your project may be marked with different files contents than the ones provided, but will have the same format and file names.

Figure 3 –Thisfile corresponds to the board in Figure 1, here shown in Excel. Theformat is comma- separated strings.
G. DIALOG WITH AND OUTPUT TO BE SHOWN TO THE USER: SEE THE SAMPLE RUNS!!!
![]()
H. HINTS: INSTALLING SPYDER, using functions in datetime and matplotlib, data structures
NEW ENVIRONMENT:
To be able to use the module matplotlib you may work in Replit or, to work locally (and get to use another environment) you may install Spyder (https://www.spyder-ide.org/). The installation of Spyder takes a while but is straightforward. This environment is more advanced than others we have used so far, and includes features that you do NOT need to use for this assignment, but you may explore if you would like. Essentially, you can edit your program and run it as you have done in other environments.
USING MODULES.
See separate documents with brief guidelines to use datetime and matplotlib. You can consult additional materials, but these explanations/examples should be enough for this project. No other built-
in modules (additionally to datetime, matplotlib.pyplot and random) may be used.
SOME RECOMMENDED DATA STRUCTURES: You will likely want to have:
![]() A 2D list with numeric values representing the board given the values in the file. (Note that to print the board in a formatted way you do NOT need to have a list of lists of strings with the exact format to be printed, but rather, you can format as you print.)
A 2D list with numeric values representing the board given the values in the file. (Note that to print the board in a formatted way you do NOT need to have a list of lists of strings with the exact format to be printed, but rather, you can format as you print.)
![]() Some lists containing the values that you will need to do the graphs
Some lists containing the values that you will need to do the graphs
![]() A list where you store one value per row, where each value is the sum of all the values in that board row. This list may be useful for you to check if all elements are even. Analogously, you may create a list with the sums per column.
A list where you store one value per row, where each value is the sum of all the values in that board row. This list may be useful for you to check if all elements are even. Analogously, you may create a list with the sums per column.
![]() Various accumulators to keep track of points, game number, turn number, etc.
Various accumulators to keep track of points, game number, turn number, etc.
SOME RECOMMENDED FUNCTIONS TO IMPLEMENT
See the provided file helper.py
WHERE TO PLACE YOUR FILES
Include the csv files in the same folder where you develop your Python program, or the same environment if using Replit
I. WHAT YOU ARE PROVIDED
a. This description
b. The files board0.csv, board1.csv, board2.csv, and board3.csv
c. Sample runs (in various files)
d. Documents with guidelines and examples to use in the datetime and matplotlib modules
e. A helper.py file with some recommended functions to be developed (the functions header and comments)
J. WHAT YOU NEED TO SUBMIT
a. A zip file with two Python files: main.py and createGraphics.py
i. Your main.py file should implement the game/s, dialog with the user, create and show the board, determine winning points, obtain times, etc. In main.py you would import your own module createGraphics and use functions defined there.
ii. Your createGraphics.py file will need to import matplotlib.
iii. You do NOT need to keep the files suggested in helper.py in that separate file/module, and may instead incorporate those functions in your main.py file.
iv. You are NOT recommended to create more Python files/modules, but you may. Just the module createGraphics and importing it in main is enough.
b. The associated reflection survey
Ifyou have any questions consult with the Teaching Team. Make sure that you check email and Canvas announcements in case that additional clarifications are provided.
End of description of the “Even/Odd Graphical game” final project.
2021-12-07