ECON Growth economics Fall 2024 Assignment 1 Part 3
Hello, dear friend, you can consult us at any time if you have any questions, add WeChat: daixieit
Growth economics
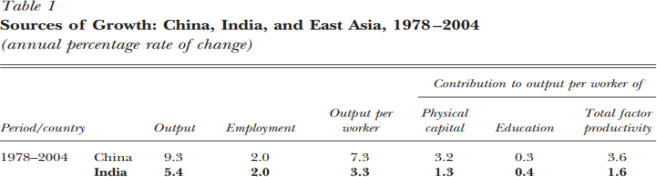
3 (a) (10 points) Replicate Table 1 from Bosworth and Collins for China and India. Use the following data sets: the Penn World Tables and Barro-Lee dataset on educational attainment.
From Penn World Tables use: (a) rgdpo for real GDP; (b) emp for total employment; (c) rnna for capital stock. From Barro- Lee use Average Years of Schooling
3 (b) (10 points) Using the same data sets, provide the numbers for the period 2005 to 2023.
|
|
|
|
|
|
Contribution to output per worker of |
||
|
Period |
Country |
Output |
Employment |
Output per worker |
Physical capital |
Education |
Total factor productivity |
|
1978-2004 |
China |
9.3 |
2.0 |
7.3 |
3.2 |
0.3 |
3.6 |
|
2005-2023 |
China |
|
|
|
|
|
|
|
1978-2004 |
India |
5.4 |
2.0 |
3.3 |
1.3 |
0.4 |
1.6 |
|
2005-2023 |
India |
|
|
|
|
|
|
3 (c) (10 points)
Do the numbers you obtained in part 3 (b) for 2005-2023 appear reasonable to you? Why or why not? Are they consistent with sources you can find on the web?
3 (d) (5 points) List the sources you used in answering question 3 (c). Which source was the most useful?
2024-09-02