Assignment 3 EE6435 February 25, 2020
This homework is due at 11:59PM on March. 5th. You can fifinish Problem 3 and 4 after next Monday’s lecture. Please submit your homework via CAN-VAS. You can type your homework solutions (appreciated). Or, you can submit
scanned version of your handwritten solutions. To make the grading standard, no partial credit will be given to computational problems. So, please be careful in computing the probabilities.
Q1 (10 pts). Consider the data set shown in Table 1.
(a) Use the estimate of conditional probabilities given in the previous question to predict the class label for a test sample (A = 0, B = 1, C = 0) using the naive Bayes approach.
(b) Estimate the conditional probabilities of part (a) using the m-estimate approach, with p = 1/2 and m = 4.
(c) Compare the two methods for estimating probabilities. Which method is better and why?
Table 1: Data set for Q1
|
Record
|
A | B | C |
Class
|
| 1 | 0 | 0 | 0 | + |
| 2 | 1 | 0 | 0 | - |
| 3 | 1 | 1 | 0 | - |
| 4 | 1 | 1 | 0 | - |
| 5 | 1 | 0 | 0 | + |
| 6 | 1 | 0 | 1 | + |
| 7 | 1 | 0 | 1 | - |
| 8 | 1 | 0 | 1 | - |
| 9 | 1 | 1 | 1 | + |
| 10 | 1 | 0 | 1 | + |
Q2. (15 pts) Consider the data set shown in Table 2.
| Record | A | B | C | Class |
| 0 | 0 | 0 | 0 | - |
| 1 | 1 | 0 | 0 | + |
| 2 | 1 | 1 | 0 | - |
| 3 | 1 | 1 | 0 | - |
| 4 | 1 | 0 | 0 | + |
| 5 | 1 | 0 | 1 | + |
| 6 | 1 | 0 | 1 | - |
| 7 | 1 | 0 | 1 | - |
| 8 | 1 | 1 | 1 | + |
| 9 | 1 | 0 | 1 | + |
(b) Repeat the analysis in part (c) using P(A = 1), P(B = 0), and P(A =1,B = 0).
(c) Compare P(C=1,B = 1 | Class = +) against P(C = 1 | Class = +) and P(B = 1 | Class = +). Are the variables conditionally independent given the class?
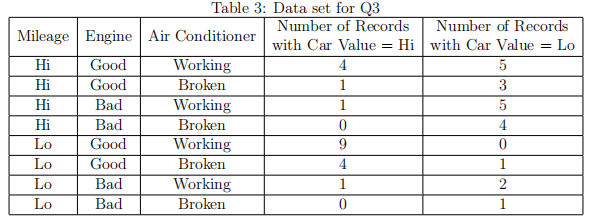
Q3 (10pts). Figure 1 illustrates the Bayesian belief network for the data set shown in Table 3
| Record | A | B | C | Class |
| 0 | 1 | 0 | 0 | - |
| 1 | 1 | 0 | 1 | + |
| 2 | 0 | 1 | 0 | - |
| 3 | 0 | 0 | 1 | - |
| 4 | 1 | 0 | 1 | + |
| 5 | 1 | 0 | 0 | + |
| 6 | 0 | 1 | 1 | - |
| 7 | 0 | 0 | 0 | - |
| 8 | 0 | 1 | 0 | + |
| 9 | 1 | 1 | 1 | + |
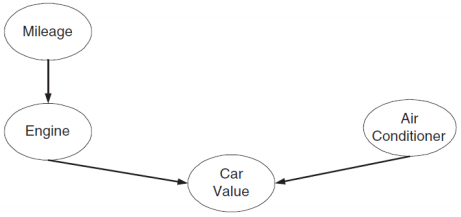
Figure 1: Bayesian belief network.
(a) Draw the probability table for each node in the network.
(b) Use the Bayesian network to compute P(Engine = Bad, Air Conditioner=Broken). Show the intermediate steps of your computation.
Q4 (10 pts). Refer to the Bayes Belief Network problem on page 7 of note 6. Compute the following probabilities:
(a) P(Blood Pressure (BP)= Low)
(b) P(HD = Yes | BP = Low)
(c) P(HD = Yes | BP = High, D = Healthy, E = No)
2020-02-24