STA237 Probability, Statistics and Data Analysis I
Hello, dear friend, you can consult us at any time if you have any questions, add WeChat: daixieit
STA237 (Probability, Statistics and Data Analysis I) - Fall 2021
Selvakkadunko Selvaratnam
Assignment 2
Q1. Assume that the duration of human pregnancies can be described by a Normal model with mean 270 days and standard deviation 15 days.
(a) What percentage of pregnancies should last between 260 and 275 days?
(b) At least how many days should the longest 20% of all pregnancies last?
(c) Suppose a certain obstetrician is currently providing prenatal care to 60 preg-nant women. What is the probability that the mean duration of these patients’ pregnancies will be less than 265 days.
(d) What is the probability that the mean duration of these patients’ pregnancies will be between 265 and 269 days.
Q2. Suppose that the random variables Y1 and Y2 have joint probability density function, f(y1, y2), given by
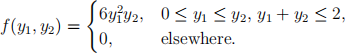
(a) Show that the marginal density of Y1 is a beta density with α = 3 and β = 2.
(b) Find P(Y2 ≥ 1|Y1 ≥ 0.5).
(c) Derive the conditional density of Y2 given Y1 = y1.
(d) Find P(Y2 > 0.8|Y1 = 0.5).
Q3. The length of time that a machine operates without failure is denoted by Y1 and the length of time to repair a failure is denoted by Y2. After a repair is made, the machine is assumed to operate like a new machine. Y1 and Y2 are independent and each has the density function
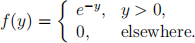
Find the probability density function for U = Y1/(Y1 +Y2), the proportion of time that the machine is in operation during any one operation-repair cycle.
Q4. Write the code to illustrate the Strong Law of Large Numbers (SLLN) for independent and identically distributed (i.i.d) sequence with the following distributions:
(i) Bernoulli distribution with parameter 0.5,
(ii) Poisson distribution with parameter 5,
(iii) Normal distribution with mean 3 and variance 9,
(iv) Exponential distribution with parameter 4.
Simulate 10000 times and use ggplot to generate graphs to visualize SLLN for the above four scenarios.
Q5. Write the code to illustrate the Central Limit Theorem (CLT) for independent and identically distributed (i.i.d) sequence with the sample size 40 for the following distri-butions:
(i) Bernoulli distribution with parameter 0.5,
(ii) Poisson distribution with parameter 5,
(iii) Uniform distribution on the interval (2, 5),
(iv) Exponential distribution with parameter 4.
Simulate 10000 times and generate histograms to visualize CLT for the above four scenarios.
2021-11-25