MMM 1041 Computer programming with MATLAB
Hello, dear friend, you can consult us at any time if you have any questions, add WeChat: daixieit
MMM 1041 Computer programming with MATLAB
Coursework 1
Introduction:
This coursework is designed to help you revise your basic MATLAB knowledge that you have gained in lectures 1-3. For each question you should write a script that contains the answers. Save your scripts to disk with some sensible name for example, the file containing the code for question one could be called Q1.m. Once you have finished all the questions (or as many as you can manage), zip all your scripts up into a single zip file and upload this to moodle. Name the zip file using the following format Firstname_surname_studentid.zip. So for example my zip file would be called:
In each .m file you generate, put on the first line your name and e-mail address – the markers will use this e-mail address to give you feedback. For questions which require you to write English sentences just include these as comments using the '%' character in a script file. Try to include comments in the script files describing what the program is doing – you will get marks for this.
Finally, please remember this is individual work and not group work. Work handed in must be entirely your own and not copied from anyone else. By all means discuss the coursework with your friends BUT then go away and write the programs yourself.
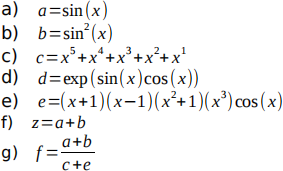
Q1: Variables
Evaluate the following functions at x=1.5
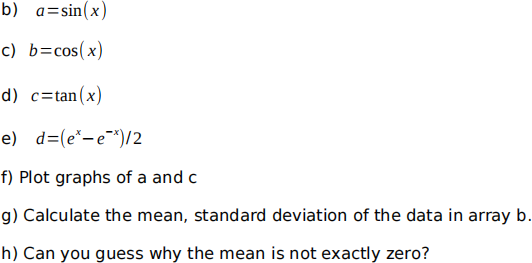
Q2: Arrays and plotting
a) Write a script to generate an array called 'x' with 100 points between -2π and 2π
Then evaluate the following functions between -2π and 2π
Q3) Program flow
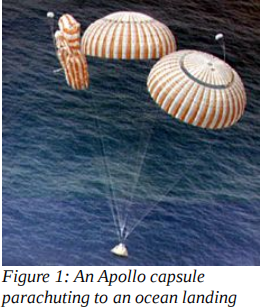
A space capsule will re-enter the earths atmosphere from space. The computer in the capsule uses it's radar to check how high it is every 100ms, once the capsule is only 1000 meters from the sea it deploys the parachute.
Once the capsule has hit he sea, the computer turns on a transponder beacon which sends out radio signal communicating the capsule's position to the rescue ships.
Both deploying the parachute and turning on the transponder beacon are handled by one program. Using boxes to represent actions and diamonds to represent decisions, sketch the structure of this program. The program must contain the following boxes:
● Am I below 1000m?
● Am I at or below 0m?
You can use any program you want to do the sketch but export it to a pdf to make sure the marker can open it. Include the pdf in your zip file as Q3.pdf.
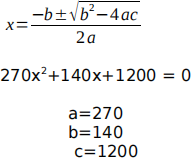
Q4: Solving equations
a) Write a script to solve the following polynomial using the quadratic formula
b) The speed of light in any material is given by the equation  where 'c' is the speed of light, the permittivity of free space is
 and the magnetic permeability is
  . The value of the relative permittivity
  , changes as a function of temperature according to the equation
 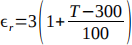 where T is given in Kelvin. Write a script to calculate the speed of light at 400 kelvin, where
 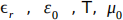 are defined as separate variables.
Q5) Give an example of the use of the following commands and describe in no more than 10 words per command, what the following commands do (Hint, the last two you can find in the MATLAB help). Use the '%' to include English text in your .m file:
Use the comment character '%' to include you description under you example in the .m file.
Q6: Processing 1D arrays
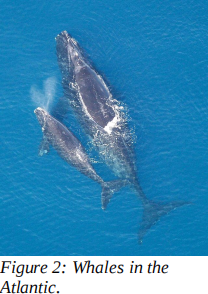
Whales keep becoming beached in the Lyme Regis on the south coast of the UK. Your small company is developing an underwater acoustic system to keep whales off the beach. The system will work by using an underwater speaker system which plays a whale distress call. It is your job to prepare the digital sound file which the system will use. By working in collaboration with a marine biologist you have obtained a recording of whale song. You can find this file in whale.zip on moodle, download the zip file and extract the file whale.dat.
Write a script to:
a) Load the file into an array called 'song', and plot a graph of the whale song. Using MATLAB, label the axis and put a title on the graph.
b) Make your script play the sound using the sound command. Hint: It plays 44100 samples (numbers) per second this must be the second argument to the sound command). What happens if you play more/less than 44100 samples per second? Write your answer in your script as a comment.
c) How many distinctive whale calls are there in the data, you should also be able to tell this from looking at the graph. Write this as a comment in the script.
d) Use the size command to find out how long the array song is, store the answer in a variable.
e) The second whale call in the sample is the distress call you are interested in. By looking at the numbers on the x-axis of your graph you will be able to tell at what position in the array this distress call starts and ends. Make a second array which only contains the distress call this should be called 'distress'.
f) Use the size command to find out how long the array 'distress' is.
g) Your company wants the device you are designing to play 10 whale distress sounds in a row one after each other. Make a new array containing ten distress calls one after each other, and edit your script to play this sound.
h) How long is this array? If the computer turning 44100 elements per second, make your script calculate the length of your new clip in seconds. To do this, first calculate the length of the new array using the size command. Hint: The size function actually returns a 2D array, containing the x and y size of any array. To do the calculation you will first have to extract the correct element from the 2D array returned by the size function.
Q7: 2D Arrays
You are an engineer on a ship searching for oil. The ship has produced a topological (sea depth) map of an area of interest. Your company now wants to drill a test well, however, there are many underwater mountains around the site of interest. It is your job to examine the topological data being produced by the ship and find a suitable flat region on the sea bed in which to drill.
a) The ship produces 2D topological (height) data and outputs this in a file called 'sea_bed.dat'. Load this file into an array and produce a 3D plot of the data. Hint: MATLAB joins the points in 2D graphs with black lines by default, if there are lots of data points this can make the graph look messy. Try adding the parameters,'edgecolor','none' to the plot command to fix this.
b) The height data in the file sea_bed.dat which the computers on the ship generated is incorrect due to a miscalibration of the instruments in the ship. To correct for this error you need to subtract 300 m from each data point in the array, the array will then give the exact depth of each location below the sea's surface. Generate a new 2D array which contains the corrected data and plot this.
c) Label the x, y and z axis of your plot. The ship records data in a resolution of one data point per meter.
d) Calculate the size of the array contained within sea_bed.dat. Store the the x and y size in separate variables, and then calculate the total area of your map in a third variable.
e) Locate a region on the sea bed which is relatively flat. Extract this region from the 2D array to form a new array called drilling_site. Produce a 3D plot of this region, again label the axis.
f) Now extract a single 1D slice across, your chosen drilling location. Plot this as a 1D graph.
g) Calculate the maximum, minimum and standard deviation of 1D data strip taken across your proposed drilling site.
2021-11-19