MDS5130/IBA6205 Project
Hello, dear friend, you can consult us at any time if you have any questions, add WeChat: daixieit
MDS5130/IBA6205 Project
Due date: May 10, 2024
❼ Outstanding projects will be invited to give a presentation on April 25 , 2024. Students who have given a presentation can receive maximum 10 bonus points in their final exam.
❼ Students who want to present their work need to submit the project by April 18, 2024. Submissions after April 18 will not be considered for presentation. All students can revise their work before May 10, 2024.
❼ The submitted codes must be clearly written in a R file.
❼ A report to describe your analysis is required.
1 Background
In this project, we will analysis a dataset about horse racing. Let’s have a brief introduction of horse racing. In a particular game, there are 14 horses racing. Before a particular time tfinal , people are allowed to bet which horse can win the game. Let bi (t) be the total amount betting on horse i at time t. Note that bi (t) is increasing before tfinal . After the game, we have bi (tfinal ) being bet on horse i for i = 1, . . . , 14. If horse I wins the game, people who bet on horse I can get the dividend
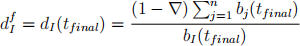
for each $1 bet, here Δ = 0.175 is the percentage track-take. Note that the dividends
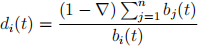
for horse i, i = 1, . . . , 14, are known by all gamers at time t < tfinal . As bi (t) is time varying, so does di (t).
Now suppose we have some insider information and we believe that we know the “true” winning probability πi of each horse i. Since we will only make a beton horse i if the expected return is greater than 1/πi , so one betting strategy is betting on horse i if di(f) > 1/πi. However, we don’tknow di(f) at time we bet (tbet ). Let bi = bi (tbet ), di = di (tbet ), fi W be the amount we bet on horse i at tbet and Ci be the amount bet on horse i by other parties after tbet. Then we have
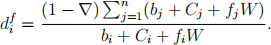
The unknown quantities here are Ci for i = 1, . . . , 14. Obviously, the amount of Ci ’s affects the accuracy of the strategies that are based on the values at time tbet. In this project, your task is to analyse the time series 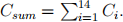
2 Data
The datasets “data20XX.RData” with XX=14,15,16,17,18 are given. They all have the same set of column names, which are
❼ ID: It is of the form “yyyymmddrr”, which means Year yyyy Month mm Date dd Race rr. Note that there are more than one race on each day and the number of races can be different on each day.
❼ WIN POOL.x: The total amount in the pool at time t bet.
bet.
❼ WIN POOL.y: The total amount in the pool at time t final . Hence Csum is the difference between WIN POOL.y and WIN POOL.x
 .
.
❼ WIN TAKE.x: Δ = 0 .175. It is the same as WIN TAKE.y
 .
.
❼ WIN ODDS i.x: d
 i = di (tbet ). If it is 0, it means that horse i actually was not in the race.
❼ WIN ODDS i.y: d
 i(f) = di (tfinal ). If it is 0, it means that horse i actually was not in the race.
❼ WIN MODEL i.x: “True” winning probability π
 i. If it is 0, it means that horse i actually was not in the race. It is the same as WIN MODEL i.y
 .
.
❼ WIN TIME.y The “yyyymmdd” part of ID .
.
❼ WIN NUMBER.y The “rr” part of ID .
.
3 Tasks
In this project, you are required to forecast Csum for each race in data2018.RData. Note that you MUST only use the information BEFORE tbet to forecast the Csum in a particular race. Let N be the total number of races in 2018, xr be the true Csum on Race r , ˆ(x)r be your forecast, and fp,r be your quantile forecast with probability p = 0.95. You should include the followings in your project.
1. (10 points) Describe clearly the model you used for forecasting xr based on the infor- mation prior to the time tbet for Race r. That is,
xr = H(Fr,t bet − ) + er , (1)
where Fr,t bet − is the information prior to the time tbet for Race r , H is some specific function you need to describe, and er is the error term.
2. (20 points) Compute the mean absolute percentage error MAPE described in Section
5.8 in the textbook “Forecasting: Principles and Practice, 3rd Ed” for you forecasts. Your codes must output the mean absolute percentage error in a variable MAPE.
3. (20 points) Compute the quantile score Q0.95,r described in Section 5.9 in the textbook “Forecasting: Principles and Practice, 3rd Ed” for each Race r in 2018. And then report the average quantile score in a variable QS.
Please note the followings.
1. Your work will be evaluated by other dataset, namely “data2019.RData”, that have the same set of columns of the given data set.
2. Only the given data set and the information provided in the project can be used. Don’t use any other additional information in your analysis.
2024-04-29