MSG469: REGRESSION ANALYSIS 2023/2024 TUTORIAL 1
Hello, dear friend, you can consult us at any time if you have any questions, add WeChat: daixieit
MSG469: REGRESSION ANALYSIS 2023/2024
TUTORIAL 1
Q1. Identify the predictor variable, x and the response variable, y in each of the following situations.
a) The Ministry of Finance wishes to investigate if unemployment rates in districts throughout Malaysia is largely contributed by the level of education attained at 18 years old.
b) A training director wishes to study the relationship between the CGPA scored after completing a bachelor degree for new recruits and their performance in given tasks in the first three months being employed.
c) The aim of a study is to relate the level of red blood cell hemolysis (breakdown of RBC) in smokers with the average number of cigarettes they smoke per day.
d) An agronomist wishes to investigate the growth rate of a fungus in relation to the level of humidity in the environment.
e) A market analyst wishes to relate the expenditures incurred in promoting a product in test markets and the subsequent amount of product sales.
f) The Ministry of Health wish to know if the chances to be infected by Covid19 is significantly higher for older people.
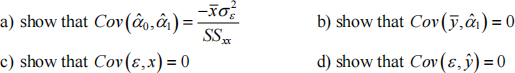
Q2. Consider the simple linear regression model: y = C0 + C1x+ε with E (ε) = 0 , Var (ε) = σε(2) and ε are uncorrelated.
Q3. Data below were obtained to investigate the relationship between advertising budget (in millions of dollars) and retained impression per week (in millions) for 21 firms.
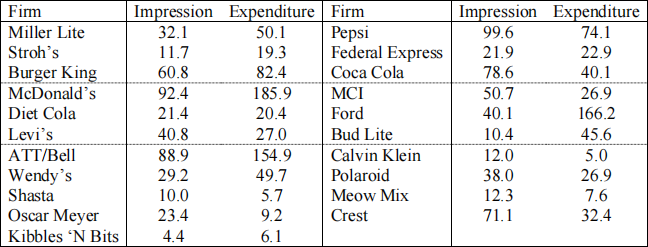
a) Plot a scatter diagram. What can you say about the nature of relationship between the two variables?
![]()
![]() b) Calculate x , y ,
b) Calculate x , y ,
c) Calculate SSxx , SSxy and SSyy using two different formulae
d) The following regression is to be estimated: Impression = λ0 + λ1Expenditure +ε . Calculate
the least squares estimates; λ0(ˆ) and λ1(ˆ) .
e) Estimate the error variance, σ2 .
f) Test H0 : λi = 0 vs. H1 : λi ≠ 0 using p-value and rejection region approaches. Do the data provide evidence that advertising expenditure is a good predictor for the impression retained on the products?
g) Construct a 95% confidence interval for the slope of the regression line. Interpret your value.
h) Compute the variability in the retained impression that is explained by the estimated regression model?
i) Estimate the mean retain impression given that the advertising expenditure was 100 million dollars and construct the corresponding 95% confidence interval.
j) Find the predicted retained impression, and the corresponding 95% prediction intervals, for two newly established company who have spent 125 and 200 million dollars in respective advertisement of their products. Comment on your values.
Q4. Consider computer company, Digital Gamma that markets and repairs small computers. The owner wishes to study the relationship between the length of a service call and the number of electronic components in the computer that must be repaired or replaced. A sample of records on service call was taken with the data consist of the length of service calls in minutes and the number of components repaired.
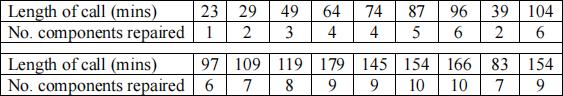
a) Produce a scatter plot and comment.
![]()
![]() b) Calculate x , y , SSxx , SSxy and SSyy
b) Calculate x , y , SSxx , SSxy and SSyy
c) Calculate the least squares estimates; β0(ˆ) and β1(ˆ)
d) Estimate the error variance, σ2 .
e) Test H0 : βi = 0 vs. H1 : βi ≠ 0 using p-value and confidence interval approaches. Do the data provide evidence that length of service call is a good predictor of number of components to be repaired?
f) How much variability in the number of components repaired is explained by the number of components being repaired?
g) Estimate the mean number of components being repaired given that the length of service call was 50 minutes and construct the corresponding 95% confidence interval.
h) Find the predicted number of components to be repaired for a new service call that lasted for 37 minutes.
Q5. Consider the regression y = C0 + C1x+ ε .
a) Suppose each value of x is multiplied by a constant, say 3. Will it change the residuals and fitted values of y? Or will it change the estimated coefficients and the R2 of the model? Show all your mathematical proves.
b) Now, suppose each value of x is multiplied by -2. Will it change the residuals and fitted values of y? Or will it change the estimated coefficients and the R2 of the model? Once again, show all your mathematical proves.
Q6. Investigate the issue in Q5 by using the data below. An experiment was conducted to study the effect of age on cholesterol level. The following table gives information on ages and cholesterol levels for a random sample often men.

a) Calculate x , y ,
b) Calculate SSxx , SSxy and SSyy using two different formulae
c) Calculate the least squares estimates; β0(ˆ) and β1(ˆ) , the estimate for the error variance, σ2 as
well as the R2 of the fitted model.
d) By obtaining the residuals and the fitted values, verify the five properties of least squares fit stated near the bottom of page 14, Chapter 1.
e) Repeat step (a) to (c) for the case of each value of x is multiplied by 2, and compares the values.
Q7. Consider the simple linear regression model: y = β0 + β1x+ ε. It was given in lecture notes
that the estimated slope is given by:
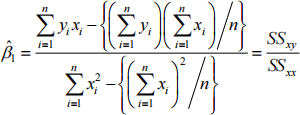
a) Show that the estimated slope can also be written as follows: 
b) Show that 
c) Defining di = xi -x , show that 
d) By writing  to represent the total variation in xi and using the fact in (c),
show that the estimated slope is unbiased, such that E( β1(ˆ)) = β1 .
Q8. The Swedish’s Ministry of Social Justice wishes to investigate if there is a relationship between the number of insurance claims and the total payment of all claims. The data below area small randomly selected data for various region in Sweden from a much larger set of data.
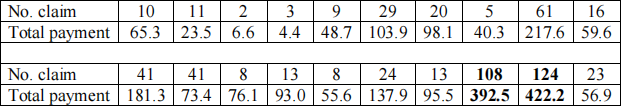
a) Calculate SSR , SSE and SST .
b) Find the equation of the least squares regression line. Give the estimated coefficients in four decimal places.
c) Calculate the standard error of the estimates and test the significance of the model coefficients.
c) Give a practical interpretation of the slope value.
d) What is the measure of goodness-of-fit of the model? What can you say about the fitted model in explaining the relationship between number of claims and total payment of all claims?
e) Using your estimated regression model, find the predicted total payments of claims if there are 55 insurance claims.
f) Repeat all the analyses above by excluding the data in bold. Compares the results, particularly with regards to the measure of goodness-of-fit.
Q9. Refer to Q3 above.
a) Find the residuals and verify that they sum to zero.
b) Calculate the residual sum of squares SSE by i) adding the squares of residuals, ii) using
the formula SSE = SSyy - SSxy(2)/SSxx . Are the values the same?
Q10. Urea is the principal nitrogenous waste product of metabolism and is generated from protein breakdown. It is eliminated from the body almost exclusively by the kidneys in urine, and measurement of its concentration, first in urine and later in blood, has had clinical application in the assessment of kidney (renal) function for well over 150 years. The data below are the ages and amount of serum urea of 20 patients admitted to accident and emergency unit at a particular hospital.
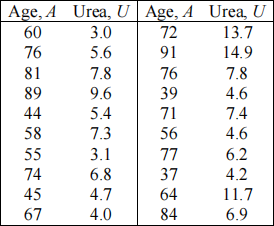
a) Compute SSxx , SSxy and SSyy . Consequently, compute the correlation coefficient,r.
b) Find the OLS coefficients of a linear regression line that can be used to predict the amount of urea. Write down the estimated regression equation.
c) Estimate the mean square error of the regression, σ(ˆ)ε(2)
d) Test the significance of the slope coefficient. What can you say about the relationship between age and amount of urea?
e) Find a 95% confidence interval for the slope coefficient. How does your result support the finding in (d) above?
f) What percent of the total variability in the amount of urea is explained by the fitted model?
g) Find a 95% confidence interval on the mean amount of urea for a group of patients at age of 65. Calculate and compare the confidence intervals for the amount of urea for a group of patients at the following age: 30, 45, 60, 75, 90 and 105. What do you learn?
![]() h) Find a 95% prediction interval for the amount of urea for a newly admitted patient at age 50.
h) Find a 95% prediction interval for the amount of urea for a newly admitted patient at age 50.
Q11.
a) Using the formulae of β1(ˆ) and SSE , show that SSE can also be expressed as
i) SSE = SSyy - β1(ˆ)SSxy ii) SSE = SSyy - β1(ˆ)2SSxx
b) Referring to the formulae of β0(ˆ) and β1(ˆ) , show that the point (x , y ) lies on the fitted regression line.
c) Using to the formulae of β0(ˆ) and β1(ˆ) , verify that
i) y(ˆ)i = y + β1(ˆ) (xi -x )
![]()
![]() ii) εi(ˆ) = (yi -y ) - β1(ˆ) (xi -x ) , consequently show that
ii) εi(ˆ) = (yi -y ) - β1(ˆ) (xi -x ) , consequently show that
iii) εi(ˆ)2 = SSyy + β1(ˆ)2 SSxx - 2β1(ˆ)SSxy = SSyy - SSxy(2) ![]() SSxx
SSxx
Q12. It has been argued that many cases of infant mortality rates are caused by teenage mothers who, for various reasons, do not receive proper prenatal care. Table below shows the data on the teenage birth rate (per 1000) and the infant mortality rate (per 1000 live births) for the 18 contiguous states. TEEN denotes the birthrate for teenage mothers and MORT denotes the infant mortality rate.
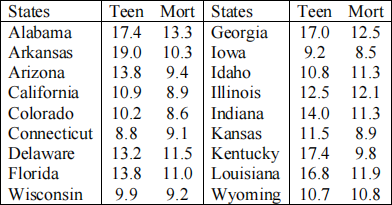
a) Calculate all the sum of squares.
b) Fit a simple linear regression model to the data. Provide the standard error of the coefficients.
c) Test the hypothesis H0 : β1 = 0 and give comment.
d) Calculate R2 and give comment.
e) Find a 95% confidence interval for the slope. Relate your interval with the results in (c).
f) Find a 95% confidence interval on the mean birthrate when the poverty level is 15.50.
g) By obtaining the residuals and the fitted values, verify the five properties of least squares fit stated near the bottom of page 14, Chapter 1.
Q13. Show that: i)  ii) SSE = (1 - r2 )SSyy iii)
Q14. An economist is interested to investigate the relationship between stock price and price index. Monthly data for a 3-year period prior to Covid- 19 were collected and are shown in table below.
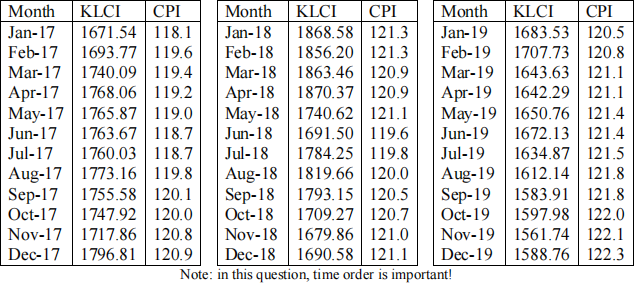
a) Construct a scatterplot of KLCI against CPI. Does the plot suggest a reasonable linear relationship between KLCI and CPI?
b) Fit a regression line predicting KLCI using CPI.
c) Obtain the 95% confidence intervals for a0 and a1
d) State the hypothesis to test for the significant of relationship between KLCI and CPI. Conduct the test and write your conclusion.
e) What proportion of the variability in KLCI is accounted for by CPI?
NOTE:
1) Solutions must be made and prepared MANUALLY, using calculator and written on paper! Solutions must be readable!
2) Each group must divide the questions among group members. It is advised for each question to be analyzed by at least 2 group members.
3) Submission is compulsory.
2024-04-17