Term Paper
Hello, dear friend, you can consult us at any time if you have any questions, add WeChat: daixieit
1 Introduction
Motivation Introduce the general topic you will deal with this paper and clarify to the audience why it is economically relevant. [No more than 200 words.]
Example: Understanding the importance of the level of education in determining the future career of a worker is important because . . .
Research question Provide details of what you want to investigate. At this stage, the reader should be aware of the exact research question you want to answer. [No more than 100 words.]
Example: In this paper I want to investigate the effect of an additional year of education on the future salary of a worker . . .
Preview of the methodology Provide some details on the methodology you use to answer the research question described above. For most of you it will be Ordinary least Squares or a variant of it. [No more than 200 words.]
Example: I estimate a regression model using data from XYZ cross-sectional data set to quantify the linear effect of an additional year of education on the future salary of a worker. . . .
Preview of the results Provide some details on the results you obtain by employing the methodology described above. [No more than 150 words.]
Example: The estimates reveal that an additional year of education has a significant negative effect on the future career of a worker. In particular, my findings reveal that a worker with four additional years of education (i.e., an undergraduate degree) has an annual wage that is on average 2,000 USD lower than the one of a worker without any post-secondary education. . . .
2 Empirics
Data section Describe the data set(s) you use to answer the research question describe above. This section needs to contain the source of the data set(s), a general description of it (e.g., Is it a cross section? How many observations? In which year? ...), and an illustration of the main variables you are going to use in the regression. Note that in practice is not simple to find a dataset to work on. My suggestion is to explore the “bcuse” command in Stata in which you can find a large number of data sets (follow this link for more information) and see if you can find an interesting research question from there. Nevertheless, feel free to use an external data set that you consider more suitable to answer your research question. [No more than 400 words.]
Example: I use a cross-sectional data set of 400 workers available from Stata using the bcuse command. Data have been collected in 1976 and contain information on the current salary of these workers (in terms of USD per hour worked), their level of education (in years), the years of experience, whether they are married or not (binary variable), whether they like playing football or not (binary variable), ... The main variables I mostly interested in is the log-transformation of the current salary of the workers and their years of education . . .
Econometric model Describe the equation you want to estimate, the estimator you want to employ, and other relevant details (e.g., Do you need robust standard errors? Why? ...). Also, be precise on discussing under which conditions the estimators are unbiased. Do you have, for instance, an omitted variable bias? If yes, it is ok, just be transparent on the potential issues and on the direction of the bias. This is extremely important for the correct
interpretation of your results. [No more than 400 words.]
Example: The objective is to estimate the following model:
log(salaryi ) = β0 + β1 educ yearsi + β2 experience yearsi + γother controlsi + ui
using Ordinary Least Squares (OLS) with heteroskedastic robust (HR) standard errors. I am using the HR standard errors because the Breusch-Pagan test is suggesting that the error displays heteroreskedasticity. The coefficient of interest is β1 as it indicates for an additional year of education how much in percentage terms the salary of a worker is going to increase. To have an unbiased estimator, the data-generating process has to be such that there is a linear relation between log(salaryi ) and educ yearsi . This does not seem to be a potential source of concern because if I plot the observations in the Cartesian plane it seems to indicate a linear relationship between the two objects. In addition, the sample has been randomly collected because the data source explains that . . . The main source of concern regards a potential correlation between the regressor of interest educ yearsi and the error ui . Unfortunately, the error ui contains innate ability, that it is not observed in the data. This implies a clear violation of assumption
4, that requires E(ut |educ yearsi ) = 0 . Thus, we should approximately expect an upward bias to the estimate β(ˆ)1
because years of education are most likely correlated with innate ability and both of them have a positive effect of the salary. It follows that when interpreting the results, I should be cautious in inferring causality in the relation because the estimate will most like . . .
Results Present all the empirical results obtained using the data and the econometric procedures described above. I suggest presenting results using tables appropriately created by Stata (see, for example, “estout” package). Please be precise in describing the table in the note below. In this section, you may also present robustness exercises in which you assess how much stable your results are if changing some elements in the regression (e.g.,
adding/removing regressors, ...). [No more than 400 words.]
Example: see next page.
Please find in Table 1 the main estimation results. Results seem to suggest an important role for education in explaining the future salary of a worker. In particular, all the estimates have a positive sign suggesting that the more the years of education, the higher the salary of a worker .... Quantitatively speaking the effect is also sizable because an additional year of education is associated with an increase in salary of 12%. Results are robust a different variety of specifications. In particular, in the first model we estimate a simple linear regression of model of the log(salaryi) on educ yearsi . In the second model we also control of experience yearsi ... In all the cases, the results confirm the overal picture that education has an effect on salary . . .
Table 1: Main estimates
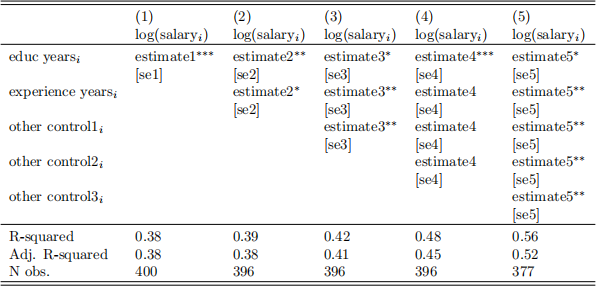
Notes. Describe (again) the dependent variable(s). Describe (again) the regressors. The model is estimated by Ordinary Least Squares (OLS). Standard errors (in square brackets) are clustered at the two-digits industry level. *, **, *** indicate statistical significance at the 10%, 5%, and 1% levels, respectively.
3 Concluding remarks
Summary of the results Here you can write a first (brief) paragraph in which you summarize everything you have done in this paper. It should have the same spirit of the introduction with the additional awareness that the reader now knows all the results and you can be a little bit more specific in commenting them. [No more than 200 words.]
Example: This paper examines the effect of education on wage. I exploit a cross-sectional data set that allows to study how the years of education affect the future salary of a group of workers in the United States in 1976. Results seem to point out an important role of education in determining wages. However, the fact that I do not observe innate ability makes the interpretation closer to a correlation rather than a causal effect. . . .
Policy implications You should also (if possible) write a second paragraph in which you discuss the implication of your results. In light of your results, should some economic agents change their behavior? Do you have any policy recommendation to the government. [No more than 200 words.]
Example: These results are particularly important because they directly speak to the recent policy programs in which the Government is decreasing the cost of tuition fees of all the public universities in the country. The aim of this program is to provide young citizens an additional incentive to complete their education. Through the lens of my analysis, all these students that will benefit from this program will enjoy higher salaries . . .
Assessment
In the evaluation, your work is assessed on two main aspects: “Contents” and “Presentation”. The “Contents” cate- gory, which carries a maximum of 70 points, focuses on the depth and relevance of the information you present. The second component, “Presentation”, accounts for 30 points and assesses how clearly and effectively you communicate your ideas. The total score you can achieve is 100.
Presentation : This aspect is subdivided into six categories: Introduction (0-5 points), Data Description (0-5 points), Data Sources (0-2 points), Econometric Estimator (0-3 points), Results (0-10 points), and Concluding Remarks (0-5 points). The total points accumulated in the “Presentation” category serve as a summary of the overall performance, categorized as follows:
❼ Unacceptable: 0-6 points. A paper in this category is virtually impossible to read and comprehend due to its severe lack of clarity in presenting content. It fails to offer a well-structured introduction, does not adequately describe the data, and omits mentioning sources. The econometric estimator is not outlined, results are presented in an unclear way, and the concluding remarks do not provide a summary of the results and do not identify any potential implications of the findings.
❼ Very deficient: 6-12 points. A paper in this category is challenging to read and comprehend due to significant issues with clarity in presenting its content. It lacks a clear introduction and data description, making it challenging for readers to understand the research context. The chosen econometric estimator needs a more explicit outline, and the results, currently presented unclearly, require restructuring with a focus on key findings. The concluding remarks should succinctly summarize the results and identify potential implications, ensuring a more cohesive and impactful conclusion.
❼ Minimally acceptable: 12-18 points. A paper in this category is readable and comprehensible, but the lack of clarity in presenting content makes comprehension challenging at times. While it features a structured introduction and includes a description of the data and its sources, there are instances of imprecision in the exposition that may hinder natural reading. The econometric estimator and key results are outlined, though a text restructuring could enhance overall clarity. In the concluding remarks, while the results are summarized, there is a missed opportunity to identify potential implications of the findings, which would contribute to a more comprehensive conclusion.
❼ Good: 18-24 points. A paper in this category is generally readable and comprehensible. It exhibits an introduction that encompasses a comprehensive description of the data and its sources. The econometric estimator and key results are outlined, and the concluding remarks summarize the results with an attempt of identifying potential implications of the findings. Generally, the language used is appropriate, with only occasional inconsistencies.
❼ Outstanding: 24-30. A paper in this category is highly readable and comprehensible. It consistently uses appropriate and precise language without any inconsistency. It exhibits a well-structured introduction that encompasses a competent description of the data and its sources. The econometric estimator and key re- sults are effectively outlined, and the concluding remarks successfully summarize the results while identifying potential implications of the findings.
Contents : This aspect is subdivided into six categories: Context/Motivation (0-20 points), Research question (0-20 points), Employed estimator (0-15 points), and Econometric assumptions (0-15 points). The total points accumulated in the “Contents” category serve as a summary of the overall performance, categorized as follows:
❼ Unacceptable: 0-14 points. A paper falling into this category lacks all the essential contents. It fails to offer a context/motivation for the empirical analysis, lacks a research question, does not employ the correct estimator, and neglects to specify the correct assumptions for obtaining an unbiased estimator.
❼ Very deficient: 14-28 points. A paper falling into this category lacks some essential elements, with many being notably deficient. It may fail to provide an interesting context/motivation for the empirical analysis, lack a clear outline of a research question, not utilize the most suitable estimator for the empirical analysis, or neglect to specify all the necessary assumptions for obtaining an unbiased estimator.
❼ Minimally acceptable: 28-42 points. A paper falling into this category includes all the essential elements, but a number of them exhibit significant issues. It might encounter challenges to find an interesting con- text/motivation for the empirical analysis. While the research question is outlined, it is not particularly interesting from an economic point of view. Although the most suitable estimator is utilized, the paper fails to articulate all the necessary assumptions essential for obtaining an unbiased estimator.
❼ Good: 42-56 points. A paper falling into this category includes all the essential elements, with only a few displaying minor issues. It provides a context/motivation for the empirical analysis with only minimal logical flaws, presents a clear research question, even if it may not be particularly interesting. It employs the correct estimator and articulates, potentially with some challenges, all the necessary assumptions essential for obtaining an unbiased estimator.
❼ Outstanding: 56-70. A paper classified in this category encompasses all the essential elements without evident issues. It furnishes an interesting and well-articulated context/motivation for the empirical analysis, introduces a precise and economically relevant research question, utilizes the correct estimator, and adeptly articulates all the necessary assumptions essential for obtaining an unbiased estimator.
2024-04-13
Introduce the general topic you will deal with this paper and clarify to the audience why it is economically relevant.