ELEC9715 Electricity Industry Operation and Control Assignment 2
Hello, dear friend, you can consult us at any time if you have any questions, add WeChat: daixieit
ELEC9715
Electricity Industry Operation and Control
Assignment 2
This assignment will be distributed to you in week 7. It is due at the end of week 9, Saturday midnight. Your submission should be a pdf document of your completed assignment submission uploaded into Moodle. The assignment must be submitted individually and must be your own work. The UNSW policy on student plagiarism can be found on thewww.lc.unsw.edu.au website and you should note that we use automated software to check assignments.
The assignment will be marked out of 20 (5 marks each for question). Late submission without good reason, as explained in an email to the course lecturer prior to the due submission time, will see marks reduced as per the details in the Course Guide. Late submissions must be directly emailed to the lecturer as well as uploaded into Moodle. In keeping with the recommended hours per week of study for a six unit of credit course, (9 hours of self-directed work per week) we suggest you spend around 20 hours in total on the assignment. The assignments are excellent preparation for the final exam, hence worth doing well, and it is essential that you do it yourself.
Question 1: Note that there is aspreadsheet to assist in answering this question available on the moodle.
Calculate the optimal unit commitment program using forward dynamic programming for the power system described below over a day’s operation. The power system has PV, Wind, Coal, CCGT and OCGT generation with technical and economic operating characteristics as shown in the table below. Note that one of the 2 coal units is required to always be on-line. Both coal2 and the CCGT can be started and stopped although there is a start-up cost for both plants that needs to factored in.
|
Generation technology |
Min. Op. level GW |
Max. Op. level GW |
Start cost $k |
Op. cost $/MWh |
|
PV |
0 |
10 |
0 |
0 |
|
Wind |
0 |
7 |
0 |
0 |
|
Coal1 |
1 |
2 |
Always on |
100 |
|
Coal2 |
1 |
2 |
600 |
100 |
|
CCGT |
0.5 |
1 |
200 |
150 |
|
OCGT |
0 |
4 |
0 |
200 |
For convenience the day is divided into 6 four time blocks. Over the day demand varies from 6 to 1 2GW, while the wind and solar also vary between 1 -4GW and 0-7GW respectively as shown in the table below. You can assume that the day-ahead forecasts for these renewables are very accurate. The residual demand after subtracting renewables that must be met from the thermal generation (Coal, CCGT and /or OCGT) is also shown. Note that the coal1 must remain committed and has a minimum operating level of 1GW. Coal2 and CCGT both have minimum operating levels as well. These minimum operating levels may of course require that PV and/or Wind be curtailed at sometimes.
|
Hours |
0-4 |
4-8 |
8-12 |
12-16 |
16-20 |
20-24 |
|
Demand |
6 |
10 |
8 |
9 |
12 |
9 |
|
PV |
0 |
0 |
7 |
7 |
3 |
0 |
|
Wind |
3 |
4 |
1 |
1 |
3 |
4 |
|
Available PV Wind |
3 |
4 |
8 |
8 |
6 |
4 |
|
Residual load |
3 |
6 |
0 |
1 |
6 |
5 |
To solve optimal unit commitment of coal2 and the CCGTand minimise total industry operating costs over the 24 hours, first calculate the operating cost for supplying this residual demand over 4 hours for the four different possible states of coal2 and CCGT commitment. In the assignment spreadsheet I have provided the table for you to complete. Note that minimum operating levels in sometime periods and states may require that you curtail some wind and/or solar generation.
Now you can solve optimal unit commitment using dynamic programming. For convenience, you can assume that just before midnight of the previous day, Coal2 is on and the CCGT is off. You can decide whether to start or stop either Coal2 or the CCGT just before the start of each 4 hour period, and the plants can be started immediately and are hence available for dispatch over that period. There are of course their start up costs to consider. You can also assume that power system operation will return to Coal2 on, CCGToff in the final 4 hour period.
Now you can complete the provided table in the spreadsheet for each possible prior state, current state for each 4 hour block. To calculate each dynamic programming element you need to add the minimum cost for the previous state, any start-up costs due to transitioning to a new state, and then the operating costs for that new state over the next four hours. Note that demand must always be met, and that if Coal2 and the CCGT are on, they must be operating at at least their minimum operating level.
From this you can determine the minimum total industry cost for the power system over the 24 hours, and any necessary plant starts or stops at each time interval. Note that it is possible there are multiple least cost pathways.
Discuss your findings and their potential implications for unit commitment of coal and CCGT plant in power systems with significant wind and solar generation and underlying power system demand that peaks in the morning and evening.
Question 2 Note that an Excel workbook with 30 minute NEM pricing for Victoria in 2023 is on the Moodle.
You are one of the trading team for a NEM market participant that owns a 1500MW brown coal plant (Yallourn W). Your plant actually has four units – two older 350MW units and two upgraded 400MW units. The operating cost of the plant is $15/MWh and the expectation is that no units will be decommitted over 2023. The minimum operating level of the plant is 900MW.
It is December 2022 and you have been asked to secure operating revenue for the coming year 202 3 . You visit the ASX Energy website and note the current state of the current CFD market.
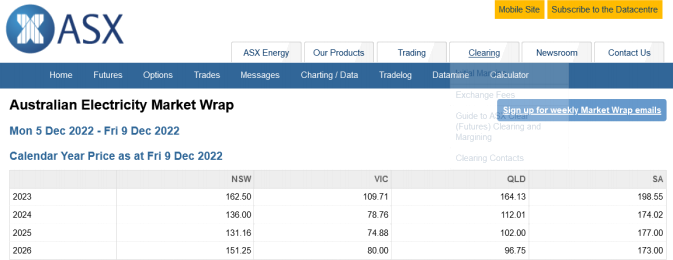
You then go to a broker who can look to arrange a bilateral contract with a large retailer at any volume up to 1500MW at the expected average Victorian wholesale price over calendar year 2023 .
Calculate the annual operating profit ($m/year) you actually make in 2023 considering the following scenarios:
- You chose not to sell a CFD and just take spot market revenue. You operate the plant at its maximum rated output 1500MW for the entire year.
- You choose not to sell a CFD and just take spot market revenue while now operating the plant at its minimum operating level when the price falls below the plant ’s operating cost, and at its maximum rated output when the price is above its operating cost.
- You sold a 1500MW CFD to a retailer at the expected average Victorian wholesale price over CY 2023 in December 2022 and then operated your plant at 1500MW for the entire year.
- You sold a 1500MW CFD to a retailer at the expected average Victorian wholesale price over CY 2023 in December 2022 and then operated your plant at its minimum operating level when the price falls below the plant’s operating cost, and at its maximum rated output when the price is above its operating cost.
- You chose to sell a CFD only to cover you for your minimum operating level over CY 2023 and then operated your plant at its minimum operating level when the price falls below the plant’s operating cost, and at its maximum rated output when the price is above its operating cost.
You can assume that your coal plant offer strategy doesn’timpact pricing (although it almost certainly would in practice). Be sure to present your results in a table showing separate CFD and spot market operating profits, as well as total operating profits for each of these 5 scenarios. Discuss your findings. If you did actually sell the a CFD only to cover you for your minimum operating level do you believe that your manager should be providing you with a bonus, or firing you? You might want to consider some reasons why 2023 might have been a rather surprising year for all NEM market participants.
Question 3 Note that an Excel workbook with 30 minute NEM pricing and a windfarm plant generation for Victoria in 2023 is on the Moodle.
Your are a trader for a company that owns a windfarm in Victoria that has previously sold a Power Purchase Agreement (PPA) to the Victorian Government for $60/MWh. This 15 year contract runs from 2018-2033. This contract is effectively a variable volume CFD and works as follows. For every 30 minute the spot price is subtracted from the PPA strike price and multiplied by the MWh generated during that time period to calculate the PPA value ($) in that 30 minute period. Note that if the wind farm is generating at an average 100MW it generates 50MWh in 30 minutes). If the spot price is greater than PPA contract price in that 30 minutes then the generator pays the Victorian government this money. If the spot price is below the PPA price then the government pays this money to the generator. The wind farm keeps all the spot market revenue.
In early 2024 you are asked by your company to assess the value of this wind farm and its trading strategy. 2023. They provide you with the 30 minute generation (MW) of the wind farm over the year. You can assume that this wind farm was not curtailed at anytime. That is, the generaion trace is how much the wind farm could potentially generate in each 30 minute period. Of course you might have chosen a different operating strategy and turned it down occasionally.
Calculate the annual operating profit ($m/year) your wind farm would have made in 2023 considering the following scenarios:
- Your wind farm had no PPA and received only spot market revenue over the year. The wind farm is operated at its maximum possible generation at each 30 minute period.
- Your wind farm had no PPA and received only spot market revenue over the year. You, however, were in charge of its market participation and choose to to turn the wind farm down in any 30 minute period if you calculated that this would increase the plant ’s operating profit.
- The wind farm does have this PPA at $60/MWh and was operated at its maximum generation potential for each 30 minute period.
- The wind farm does have this PPA but in the fine print there is the following legal rider – “for the purpose of calculating the value of the CFD in each 30 minute period any negative market prices shall be defined as $0/MWh for the purpose of the calculation” The wind farm is still operated at it’s maximum generation potential over the year.
- The PPA has this fine print, but you have now calculated an optimal dispatch strategy to maximise the operating profit of the wind farm.
Think carefully what the optimal curtailment strategy is given both in terms of not having any PPA, or having this PPA with that fine print. It’s not necessarily the most obvious strategy :?). You can assume that your wind plant dispatch strategy doesn’t impact pricing which is a reasonable assumption. Be sure to present your results in a table showing separate CFD and spot market operating profits, as well as total operating profits for each of these 5 scenarios. Discuss your findings and the importance of carefully designing renewable PPAs in a highly volatile spot market to manage risks for both PPA sellers and buyers, and for renewable energy projects to be responsive to changing market conditions in such cases.
Question 4: Note that there is a spreadsheet available on the moodle which may assist you layout your answer.
A power system has a mix of old thermal coal plant, CCGT OCGT gas fired generation as well as considerable wind generation with overall capacity and operating costs as shown below (note the similarities with Victoria).
The coal plant is old and becoming unreliable with an estimated forced outage rate of 0.1 for 1000MW of the plant (that is, you can expect that 1000MW of the brown coal plant is unavailable 10% of the time). The 4500MW of wind generation has the following overall probability distribution – 3500MW for 10% of the time, 1800MW for 70% of the time and 1000MW for the remaining 20% of the time (yes – rather simplified). There is also 1500MW of solar energy which can be roughly modelled as providing 1000MW 50% of the time, and 0MW for the other 50% of the time)
All of this serves a load with the inverted load duration curve shown below. Note that the value of any Unserved Energy (USE) is estimated to be $15,000/MWh. Assume that the wind farm output, solar farm output and load, as well as the coal plant forced outages are all completely uncorrelated (meaning that the probability of being in any of the coal, wind, solar and demand states is independent of what the other states are so yes, rather simplified). Also assume all plants can be operated anywhere between 0MW and their rated capacity, with no start-up or shutdown costs (a very big assumption for brown coal).
|
Generation technology |
Total Capacity (MW) |
Incremental variable cost ($/MWh) |
Forced outage rate |
|
Brown coal |
4500 |
20 |
0.1 for the loss of 1000MW |
|
CCGT |
500 |
80 |
0 |
|
OCGT |
2500 |
150 |
0 |
|
Wind |
4500 |
0 |
0 (but resource dependent) |
|
Solar |
1500 |
0 |
0 (but resource dependent) |
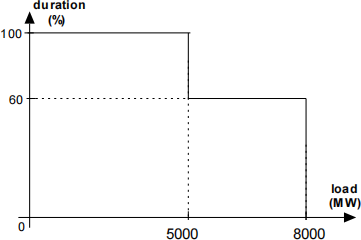
The simulation period is one year ahead. Using a table to present your results, enumerate all possible scenarios of generation availability, wind farm and PV output and load demand in terms of their probabilities (hence expected hours per year), ability to meet demand, and associated power system production costs ($/hr). Note that there area total 24 possible states for this power system (3 wind states X 2 brown coal availabity states X2 demand states and 2 solar states). Use this table to calculate over atypical year:
(a) Loss of load probability (total hours/year)
(b) Expected unserved energy (USE) (% of load)
(c) Expected production cost over the year ($000) noting again that any USE costs $15,000/MWh.
(d) Average price required to cover total production costs.
Briefly discuss your findings and their potential implications for this power system as the brown coal plant continues to age.
2024-04-13