ECO2121 Basic Statistics: Problem Set 4
Hello, dear friend, you can consult us at any time if you have any questions, add WeChat: daixieit
ECO2121 Basic Statistics: Problem Set 4
Due Date: April 14 (Sunday), 11:59pm
Total Points: 100 points
Instruction: You can type or hand-write your answers. Please indicate clearly the question numbers. In the free response questions and data analysis questions, please show steps of calculation or detailed explanation. You are free to choose any software package in the data analysis questions. But be sure to present the machine outputs in human readable formats.
Academic Integrity: Copying is NOT allowed. If your answers are from collaborated work with other classmates, please cite properly. Identical answers in non-multiple-choice questions without citation are considered as cheating. For more details, please refer to the course syllabus.
Note: If possible, please scan your hand-written answers using APP like Adobe Scan in smart phones and upload your answers in .pdf format to the Blackboard. Please check the legibility of your file before uploading.
I. Multiple Choices or Fill in the Blank (30 points in total, 2 points for each question)
1. The expected value of  equals the mean of the population from which the sample is drawn
a. only if the sample size is 30 or greater
b. only if the sample size is 50 or greater
c. only if the sample size is 100 or greater
d. for any sample size
2. The standard deviation of a point estimator is the
a. standard error
b. sample statistic
c. point estimate
d. sampling error
3. The value of the is used to estimate the value of the population parameter.
a. population statistic
b. sample parameter
c. population estimate
d. sample statistic
4. A simple random sample of 5 observations from a population containing 400 elements was taken, and the following values were obtained.
12 18 19 20 21
A point estimate of the population mean is
a. 5
b. 18
c. 19
d. 20
5. The sampling distribution of the sample mean
a. is the probability distribution showing all possible values of the sample mean
b. is used as a point estimator of the population mean μ
c. is an unbiased estimator
d. shows the distribution of all possible values of μ
6. As the sample size increases, the variability among the sample means
a. increases
b. decreases
c. remains the same
d. depends upon the specific population being sampled
7. Random samples of size 49 are taken from a population that has 200 elements, a mean of 180, and a variance of 196. The distribution of the population is unknown. The mean and the standard error of the distribution of sample means are
a. 180 and 24.39
b. 180 and 28
c. 180 and 1.74
d. 180 and 2
8. In determining an interval estimate of a population mean when σ is unknown, we use a t distribution with
a.  degrees of freedom
b.  degrees of freedom
c. n - 1 degrees of freedom
d. n degrees of freedom
9. Random samples of size 36 are taken from a process (an infinite population) whose mean and standard deviation are 20 and 15, respectively. The distribution of the population is unknown. The mean and the standard error of the distribution of sample mean are
a. 36 and 15
b. 20 and 15
c. 20 and 0.417
d. 20 and 2.5
10. The fact that the sampling distribution of the sample mean can be approximated by a normal probability distribution whenever the sample size is large is based on the
a. central limit theorem
b. fact that there are tables of areas for the normal distribution
c. assumption that the population has a normal distribution
d. All of these answers are correct.
11. It is known that the variance of a population equals 1,936. A random sample of 121 has been taken from the population. There is a .95 probability that the sample mean will provide a margin of error of
a. 7.84 or less
b. 31.36 or less
c. 344.96 or less
d. 1,936 or less
12. From a population that is normally distributed with an unknown standard deviation, a sample of 25 elements is selected. For the interval estimation of μ, the proper distribution to use is the
a. standard normal distribution
b. z distribution
c. t distribution with 26 degrees of freedom
d. t distribution with 24 degrees of freedom
13. A random sample of 25 employees of a local company has been measured. A 95% confidence interval estimate for the mean systolic blood pressure for all company employees is 123 to 139. Which of the following statements is valid?
a. 95% of the sample of employees has a systolic blood pressure between 123 and 139.
b. If the sampling procedure were repeated many times, 95% of the resulting confidence intervals would contain the population mean systolic blood pressure.
c. 95% of the population of employees has a systolic blood pressure between 123 and 139.
d. If the sampling procedure were repeated many times, 95% of the sample means would be between 123 and 139.
14. The general form of an interval estimate of a population mean or population proportion is the plus and minus the .
a. population mean, standard error
b. level of significance, degrees of freedom
c. point estimate, margin of error
d. planning value, confidence coefficient
15. A random sample of 25 statistics examinations was taken. The average score in the sample was 76 with a variance of 144. Assuming the scores are normally distributed, the 99% confidence interval for the population average examination score is
a. 70.02 to 81.98
b. 69.82 to 82.18
c. 70.06 to 81.94
d. 69.48 to 82.52
II. Free Response (70 points in total)
Show detailed steps for the questions in this section.
1. (10 pts) A simple random sample of 8 employees of a corporation provided the following information.
Employee 1 2 3 4 5 6 7 8
Age 25 32 26 40 50 54 22 23
Gender M M M M F M M F
a. (2 pts) Determine the point estimate for the average age of all employees.
b. (4 pts) What is the point estimate for the standard deviation of the population?
c. (4 pts) Determine a point estimate for the proportion of all employees who are female.
2. (10 pts, 2 pts each) The following information gives the number of days absent from work for a population of 5 workers at a small factory.
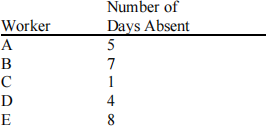
a. Find the mean and the standard deviation for the population.
b. Samples of size 2 will be drawn from the population. Use the answers in part a to calculate the expected value and the standard deviation of the sampling distribution of the sample mean.
c. Find all the samples of 2 workers that can be extracted from this population. Choose the samples without replacement.
d. Compute the sample mean  for each of the samples in Part c.
e. Graph the sample means with the values of  on the horizontal axis and the corresponding relative frequency on the vertical axis.
3. (10 pts) Missy Walters owns a mail-order business specializing in baby clothes. Missy is confident the dollar amounts of all her orders are normally distributed or nearly so. Assume she knows the mean and standard deviation are $249 and $46, respectively, for all orders she receives.
a.(2 pts) Describe the sampling distribution of , where is the mean dollar-amount of an order for a sample of 10 orders.
b.(4 pts) What is the probability that a simple random sample of 30 orders will provide an estimate of the population mean dollar-amount of an order that is within plus or minus $10 of the actual population mean?
c. (4 pts) What happens to the sampling distribution of when the sample size is increased from 30 to 90? With a sample size of 90, what is the probability that will be between $239 and $259?
4. (15 pts) A random sample of 49 lunch customers was taken at a restaurant. The average amount of time the customers in the sample stayed in the restaurant was 33 minutes. From past experience, it is known that the population standard deviation equals 10 minutes.
a. (3 pts) Compute the standard error of the mean.
b. (4 pts) What can be said about the sampling distribution for the average amount of time customers spent in the restaurant? Be sure to explain your answer.
c. (4 pts) Construct a 95% confidence interval for the true average amount of time customers spent in the restaurant.
d. (4 pts) With a .95 probability, how large of a sample would have to be taken to provide a margin of error of 2.5 minutes or less?
5. (15 pts) Fifty students are enrolled in an Economics class. After the first examination, a random sample of 5 papers was selected. The grades were 60, 75, 80, 70, and 90.
a. (3 pts) Calculate the estimate of the standard error of the mean.
b. (4 pts) What assumption must be made before we can determine an interval for the mean grade of all the students in the class? Explain why.
c. (4 pts) Assume the assumption of Part b is met. Provide a 90% confidence interval for the mean grade of all the students in the class.
d. (4 pts) If there were 200 students in the class, what would be the 90% confidence interval for the mean grade of all the students in the class?
6. (10 pts, 5 pts each) An apartment complex developer is considering building apartments in College
Town, but first wants to do a market study. A sample of monthly rent values ($) for studio apartments in College Town was taken. The data collected from the 70-apartment sample resulted in a sample mean of $490.80. (Based on past experience, the developer assumes a known value of s= $55 for the population standard deviation.)
a. Develop a 98% confidence interval for the mean monthly rent for all studio apartments in this city.
b. Suppose the apartment developer wants a 98% confidence interval estimate of the population mean with a margin of error of E = $10. How large a sample size is needed?
2024-04-09