BIOC0036 2024 Practical and Computational Biomolecular Structure and Function
Hello, dear friend, you can consult us at any time if you have any questions, add WeChat: daixieit
BIOC0036 2024
Practical and Computational Biomolecular Structure and Function
Practical sessions
Tuesday 16th Jan 2024 Experiment 1. Purification of ovalbumin and determination of reactive thiols in native and denatured protein;
Cruciform building, G.101
Tuesday 23rd Jan 2024 Experiment 2. Bioinformatics practical;
Online
Tuesday 30th Jan 2024 Experiment 3. Electrophoretic separation of proteins;
Cruciform building, G.101
Tuesday 6th Feb 2024 Experiment 4. The effects of temperature on enzyme activity;
Cruciform building, G.101
UNITS OF MEASUREMENT
These are subdivided by the use of the following prefixes:
pico- 1 million millionth part 10-12
nano- 1 thousand millionth part 10-9
micro- 1 millionth part 10-6
milli- 1 thousandth part 10-3
centi- 1 hundredth part 10-2
kilo- 1 thousand times 103
mega- 1 million times 106
Units of Mass
Express mass in terms of grams or moles (or multiples or divisions of these units).
Unit of Amount of Substance
The mole is the amount of substance of a system which contains as many elementary entities as there are atoms in 0.012 kilogram of carbon 12; its symbol is "mol." In other words, a mole is the amount of pure substance containing 6.022 × 10²³ (Avogadro’s number) of chemical units.
One mole of a substance is that amount of substance having a mass of m grams where m is the relative molecular mass of the substance.
Units of Concentration
The concentrations of solutions will be expressed in terms of molarity (e.g. 0.5M H2SO4) where a molar solution contains 1 mole of solute per litre of solution, or as a %. As the term % is ambiguous (it can refer to grams of solute per 100 millilitres of solution), it is essential to express % concentrations either as % w/w or % w/v.
Abbreviations (These have no plural form)
Kilogram kg litre L
gram g millilitre (10-3 L) mL
milligram (10-3 g) mg microlitre (10-3 mL) μL
microgram (10-6 g, 10-3 mg) μg metre m
nanogram (10-9 g, 10-6 mg) ng centimetre cm
mole no abbreviation millimetre mm
millimole (10-3 mole) mmole micron (10-6 m) μm
nanomole (10-9 mole) nmole Ångstrom (10-10 m) Å
molar (moles per litre) M hour h
millimolar (mmoles per litre) mM minute min
micromolar (µmoles per litre) µM second s
nanomolar (nmoles per litre) nM millisecond ms
Useful Atomic Weights
Bromine 79.92
Calcium 40.08
Carbon 12.01
Chlorine 35.46
Hydrogen 1.01
Iodine 126.92
Iron 55.85
Magnesium 24.32
Nitrogen 14.01
Oxygen 16.00
Phosphorous 30.98
Potassium 39.10
Sodium 23.00
Sulphur 32.06
IT IS IMPORTANT THAT YOU READ THROUGH THE EXPERIMENT BEFORE YOU START
PURIFICATION OF OVALBUMIN AND DETERMINATION OF REACTIVE THIOL GROUPS IN NATIVE AND DENATURED PROTEIN
INTRODUCTION
In globular proteins, the ionic groups tend to be found on the surface of the protein, while the hydrophobic groups are located in the interior. By using specific reagents to disrupt intramolecular bonding, the protein can be denatured. By titrating reactive chemical groups in the folded and unfolded protein, the location of the groups can be determined.
In this experiment, we determine the accessibility of thiol groups in protein ovalbumin by chemical titration in the presence and absence of denaturing agents. You will purify ovalbumin from an egg white and as the denaturing reagents you would use Guanidine-HCL and urea.
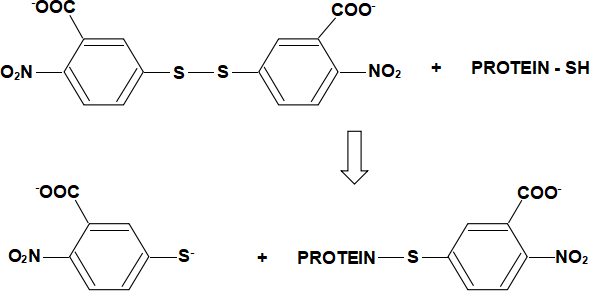
Thiol Groups
Thiol groups are usually located in the protein interior (where they are protected from oxidation) and are thus only accessible after protein denaturation. These groups can be determined quantitatively by reaction with 5,5’-dithio-bis(2-nitrobenzoate), which yields the yellow nitromercaptobenzoate ion. The reaction is shown below:
EXPERIMENT
1. Preparation of ovalbumin (approx. 1 hour)
The laboratory staff will separate the white of an egg and you will be given a sample of egg whites at the start of the experiment. Pour the egg white into a plastic 50 ml tube provided and note the volume of the egg white (V= ). Place the tube on ice. Stir the white gently with a glass rod to break up the membranes. While stirring continuously, add slowly an equal volume of saturated ammonium sulphate. Centrifuge (10 minutes at 4000 r.p.m. -- on a bench-top centrifuge) then KEEP the supernatant by using a Pasteur pipette to transfer the supernatant solution into a clean tube. Discard the precipitate.
To the supernatant solution, add 0.5 M H2SO4 dropwise until the solution turns cloudy and the precipitate forms. At that point the pH of the solution should be at around pH 4.6. You will be provided with pH measuring strips, but if you wish to check your pH by using pH meter do ask a demonstrator for help. If you drop the pH too far, the precipitate may re-dissolve! Centrifuge (as above) and carefully decant (pour out) and discard the supernatant but keep the precipitate.
To the precipitate, add 10ml of dH2O. Vortex vigorously to dissolve the precipitate. Measure the absorbance at 280nm in a UV cuvette. If the reading is off-scale, take 1 ml of your ovalbumin solution and prepare a 1:10 dilution in dH2O and try again.
Calculate the protein concentration of your original (non-diluted) sample by using the relationship:
1mg/ml protein has an A280 of 1.0.
Dilute your partially purified ovalbumin preparation to an approximate concentration of 5mg.ml-1 with the phosphate buffer provided (0.1M Na2HPO4/NaH2PO4 buffer, pH 7.2). This solution will be used for part 2 below.
2. Determination of thiol groups (½ hour)
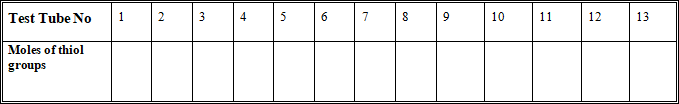
Set up a series of test tubes according to the details outlined in the Table below:
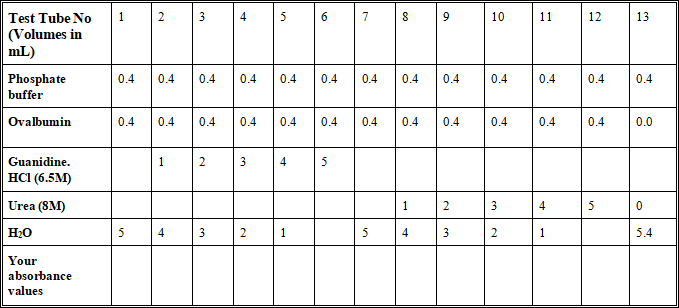
Once you have prepared these mixtures, you are ready to determine the thiol content by reaction with 5,5’-dithio-bis-(2-nitrobenzoate) (DTNB). Note that the coloured product fades within 3-4 minutes and it is important that you measure the absorbance within 2 minutes of the addition of DTNB. Do not add DTNB to any of the tubes before you are ready to take a measurement.
First add 0.2ml of DTNB (provided at 4mg.ml-1 in 0.1M phosphate buffer, pH 7.2) to the blank (tube 13) and zero the spectrophotometer at 412nm. Then, starting with tube 1, add 0.2ml of DTNB to the tube, mix by inversion, transfer to a plastic cuvette, and read absorbance at 412nm. Repeat for all other tubes in succession by adding DTNB to individual tube, mixing the solution and taking measurements. Record the absorbance using plastic cuvettes.
1. In this crude ovalbumn purification protocol, what is the role of ammonium sulphate in the first step? (1 mark)
2. And why is sulphuric acid added in the subsequent purification step? (1 mark)
3. Calculate the moles of thiol group for each sample. The molar extinction coefficient of the nitromercaptobenzoate ion is 1.36 x 10⁴ M-1cm-1. Plot the number of moles of reacting thiol group against the concentration of the denaturant. (3 marks)
4. Using your graph, estimate the total amount of thiol groups in your sample and calculate the number of free cysteine residues per molecule of ovalbumin. The molecular weight of ovalbumin is 45,000. (2 marks)
5. What does your data tell you about the number of interior and surface cysteine residues? (1 mark)
6. When you determined protein concentration of your sample you made dilution of 1:10. If you have diluted your sample 1:20 and you obtained A280=0.36 what would have been the molar concentration of your sample? (2 marks)
Electrophoretic Separation and Detection of Proteins
Introduction
immobilized-metal affinity chromatography (IMAC)
A recombinant protein containing engineered poly-His tag at either N- or C-terminus can be purified from the cell-extracts by Ni-NTA Agarose. The method employs nickel-nitrolotriacetic acid (NTA) metal affinity chromatography where NTA coupled to agarose beads provides four of the six binding sites in the coordination sphere of the Ni2+ ion. Additional two coordination sites are then occupied by the His side chains from the protein tag. Upon binding of the tagged protein, non-specifically associated proteins from the cell-extracts or protein mixture could be washed out from the resin. The target, the His-tagged protein, is finally eluted from the beads with the elution buffer containing high imidazole concentration. In this experiment, we will partially purify recombinant 6xHis-tagged TEV protease that was expressed in E. coli.
Separation and detection of proteins
Various separation methods are routinely used for the separation of proteins, the choice of separation matrix depending on the application.
Polyacrylamide gel electrophoresis (PAGE): PAGE is highly adaptable, being suitable for both native and denaturing electrophoresis (for separation of native proteins and protein subunits respectively) and for either analytical or preparative applications. Protein separation based primarily on electrophoretic mobility is achieved by addition of sodium dodecyl sulfate (SDS) to protein sample. SDS is an anionic detergent which linearizes (denatures) and coats the proteins ensuring that proteins are evenly negatively charged. The most commonly used SDS-PAGE system is that described by Laemmli in 1970 (Nature 227 (5259): 680–685).
The visualisation of proteins separated on electrophoresis gels may be non-specific (e.g., using a general protein stain such as Coomassie Blue or Amido Black) or specific for some structural (e.g., an antibody epitope) or functional (e.g., an enzyme activity) component of the protein.
Following the purification of TEV protease we will perform an SDS-PAGE for protein detection and staining. In addition, the demonstrators will show you the basic steps involved in ‘Western Blot’ analysis. Protein gels will be stained by Instant Blue stain which is a ready-to-use, proprietary Coomassie G-250 stain. The demonstrators will be carrying out electrophoretic transfer of proteins from the SDS-PAGE gels to the Polyvinylidene difluoride (PVDF) membrane which will then be incubated with the specific antibodies. We will be using monoclonal anti-His tag antibody conjugated to horseradish peroxidase (HRP) enzyme. Visualization of the protein bands will be enabled by the addition of HRP substrate TMB. TMB (3,3´,5,5´-tetramethylbenzidine) reacts with HRP to produce an insoluble dark blue precipitate.
EXPERIMENT
At the beginning of the experiment you will be given a sample of the TEV protease expressing E.coli cell extract and the mammalian tissue extracts prepared by the laboratory staff.
Part A. Purification of recombinant His-tagged TEV protease using Ni-NTA agarose beads.
· Ni-NTA beads have been pre-equilibrated with the sonication buffer used for solubilisation of E. coli cells and preparation of soluble cell extracts. The buffer contains 25 mM Tris-HCl, pH 8.0, 500 mM NaCl, 1mM beta-mercapto-ethanol (BME) and 20 % glycerol.
· Add 1 ml of the E. coli cell extract to the Eppendorf tube containing 0.1 ml of Ni-NTA beads. This should be now mixed gently on the provided apparatus for at least 30 min.
· While the sample is incubating,
o you should label the first set of three Eppendorf tubes as follows: flow-through, wash1, elution.
o you should label a second set of four tubes as: flow-through, wash1, elution1, tissue.
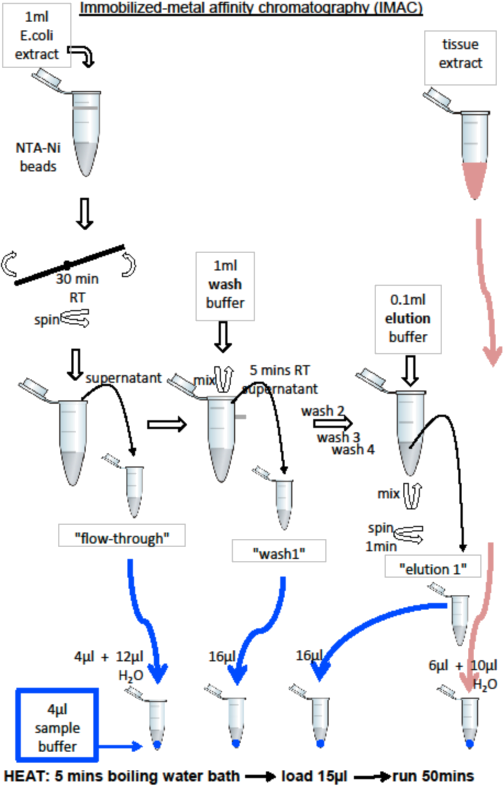
o See the figure on the next page to better understand the protocol.
· Prepare 10 ml of your ‘wash buffer’ and ‘elution buffer’ for the purification step, starting from the stock solutions provided. ‘Wash buffer’ should contain: 20 mM Imidazole, 25 mM Tris-HCl, pH 8.0, 500 mM NaCl, 1mM BME and 20 % glycerol. ‘Elution buffer’ should contain 300 mM Imidazole, 25 mM Tris-HCl, pH 8.0, 500 mM NaCl, 1 mM BME and 20 % glycerol. Prepare the buffers according to the following table:
Table 1:
|
|
‘Wash Buffer’ |
‘Elution Buffer’ |
|
1M Tris-HCL, 40 mM BME |
0.25 ml |
0.25 ml |
|
2.5 M NaCl |
2.0 ml |
2.0 ml |
|
1M Imidazole |
0.2 ml |
3.0 ml |
|
50 % glycerol |
4.0 ml |
4.0 ml |
|
H2O |
3.55 ml |
0.75 ml |
1. At the end of the sample incubation period, the tube should be spun down for 1 min at low speed. Transfer the supernatant carefully into the tube labelled ‘flow-through’ making sure that you do not disturb the beads at the bottom of the tube. Now add 1 ml of ‘wash buffer’ to the tube containing the beads, close the lid and mix the content gently by inverting the tube 10 times. Leave the tube on the bench for 5 min for the beads to settle at the bottom or spin at low speed for 1 min. Remove the supernatant and transfer it to the tube labelled ‘wash1’. Repeat the washing step 3 more times, discarding the supernatant after each repetition (we no longer need to keep the supernatant at that point). At the end, add 0.1 ml of ‘elution’ buffer to the beads and mix the beads gently by inversion for 20 sec, spin the tube for 1 min and then gently remove the supernatant by transferring it into tube labelled ‘elution’.
2. You are now ready to prepare samples for SDS-PAGE. In each of the tubes from the second set add 4 ml of Sample Buffer (Sample Buffer is composed of 0.25M Tris-HCl buffer, pH 6.8, 4% w/v sodium dodecyl sulfate, 5% v/v mercaptoethanol, 20% v/v glycerol, 0.001% bromophenol blue. This denaturing solution will dissociate subunits, reduce disulfide bonds and completely unfold proteins).
3. Add 4 ml of ‘flow-through’ fraction to the ‘flow-through’ tube containing Sample buffer. To the same tube add additional 12 ml of H2O.
4. Add 16 ml of ‘wash1’ and ‘elution’ to the respective tubes.
5. Add 6 ml of tissue extract and 10 ml of water to the ‘tissue extract’ tube.
6. Heat the samples in water baths for 5 min.
7. Load the gels with the assistance from the demonstrators. Load 15 ml of each sample. Start electrophoresis according to the manufacturer protocol and allow 50 min for the gel electrophoresis to complete.
8. When the gels are finished, they will be taken out and placed into Instant Blue staining solution.
WHILE WAITING FOR GELS:
In analogy to Table 1, create a table for preparing 20 ml of:
Buffer A: 75 mM Tris-HCL, 100 mM NaCl, 75 mM Imidazole, 10 % glycerol, 1mM BME
Buffer B: 200 mM Tris-HCL, 250 mM NaCL, 100 mM Imidazole, 5 % glycerol, 10 mM BME
But starting from the following stock solutions:
1M Tris-HCl
2.5 M NaCl
1M Imidazole
50 % glycerol
1M BME
Part B. Demonstration of the Western Blot Analysis method
Demonstrators will show you how the transfer apparatus is assembled such that proteins are transferred from the SDS-PAGE to the PVDF membrane. In addition they will run you through the process of blotting the membrane with the antibodies and finally they will demonstrate development of the specific staining.
2. If you were to start from the stock solutions shown below, how would you prepare 30 ml of a buffer with the following composition: 100 mM Tris-HCL, 100 mM NaCl, 300 mM Imidazole, 20 % glycerol, 2 mM BME? Show your calculations and present your results in tabular fashion. (3 marks)
Stock solutions:
1 M Tris-HCl
2.5 M NaCl
1 M Imidazole
50 % glycerol
1 M BME
3. Sketch and explain the results of the Western Blot Analysis following the development of the stain. (3 marks)
THE EFFECT OF TEMPERATURE ON ENZYME ACTIVITY AND STABILITY
INTRODUCTION
The concept of an "optimum" temperature for enzyme activity (i.e., the temperature at which the best catalytic rate can be obtained) appears frequently in papers on the characterisation of enzymes. This concept is highly misleading, however. Although the turnover number does indeed rise with increasing temperature, so also does the rate of protein denaturation. Thus the "optimum temperature for activity" is an experimental artefact strongly dependent on the reaction conditions.
This can be clearly illustrated graphically. If, for example, we follow the time-dependent production of product from the reaction of a hypothetical enzyme at different temperatures, we might expect the following graph (for an enzyme which is stable at 20 ºC but rapidly denatured at 70 ºC).
[Using a 1 minute reaction period, it appears that the "optimum temperature for activity" is greater than 70 ºC, while a 10 minute reaction period gives a value of about 40 ºC.]
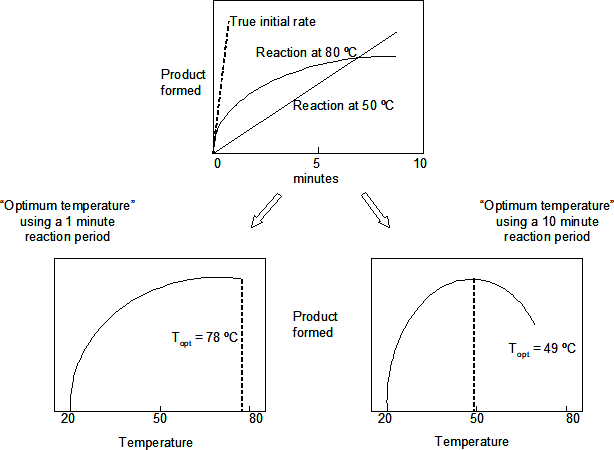
This experiment is designed to show the way in which "temperature optimum" can differ with reaction time. The data will also be used to plot the relationship between temperature and reaction rate in the Arrhenius form, from which the activation energy of the reaction can be determined.
Note: The Arrhenius equation is: v = Ae-Ea/RT.
A plot of ln v versus 1/T gives a linear plot with a slope of -Ea/R (here T is in Kelvins).
In practical terms, the Arrhenius law states that for every 10 º rise in temperature, reaction rates should increase by a factor of 2.
Assay Procedure for b-galactosidase
The procedure for assaying b-galactosidase is based on the hydrolysis of the chromogenic substrate ONPG (o-nitrophenyl-b-D-galactopyranoside).
o-nitrophenyl-galactoside ────────────> o-nitrophenol + galactose
b-galactosidase
The dissociated o-nitrophenolate ion (ONP) has an extinction coefficient at 410nm (pH 10) of 2.13 x 10⁴ M-1 cm-1.
2024-03-15