STAT340 Midterm - in class portion
Hello, dear friend, you can consult us at any time if you have any questions, add WeChat: daixieit
STAT340 Midterm - in class portion
Multiple choice questions 2pts each
MC1
You run a test with a significance level of 0.05, and calculate a p-value of 0.134. Which of the following is a valid conclusion?
a. The test provides conclusive evidence that the null hypothesis is true.
b. The test tells us that there’s only a 13.4% chance that the null hypothesis is true.
c. The test suggests that our significance level was set too low, we should re-run the test with a higher significance level. d. The test tells us if H0 were true there’s a 13.4% chance data like ours (or more extreme) would be observed.
e. The test provides evidence that there is a 86.4% chance that the alternative hypothesis is correct.
MC2
A Monte Carlo simulation of 10k iterations resulted in the below distribution of test statistics (see plot). Which of the following test and statistic would give the lowest p-value? (Remember left-tailed means Ha uses < and right-tailed means >)
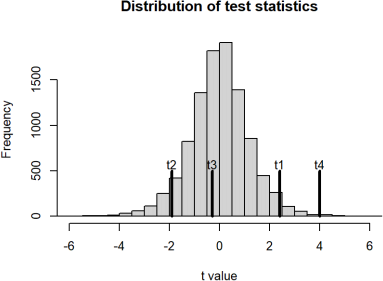
a. t2, as a two-tailed test
b. t1, as a right-tailed test
c. t3, as a left-tailed test
d. t4, as a left-tailed test
e. t1, as a two-tailed test
MC3
A consulting company is investigating whether some new project management software will help workers be more productive than the old software. Let the null hypothesis be that the new software makes no difference, and the alternative be that the new software improves productivity. For each blank below, choose one of the following: A: Type I error, B: Type II error, or C: Correct
conclusion
i. The new software DOES make workers more efficient, and they conclude that it DOES
ii. The new software DOES make workers more efficient, and they conclude that it does NOT
iii. The new software does NOT make workers more efficient, and they conclude that it DOES
iv. The new software does NOT make workers more efficient, and they conclude that it does NOT
MC4
Which is the correct ending for this statement with regards to Monte Carlo testing and estimation?
“Increasing the number of Monte Carlo runs …”
a. …gives more consistent results.
b. …lowers the chance of a Type 1 Error.
c. …increases the power of a hypothesis test.
d. …results in lower p-values.
e. …can compensate for a small amount of data.
MC5,6
The next two questions are based on the following plot.
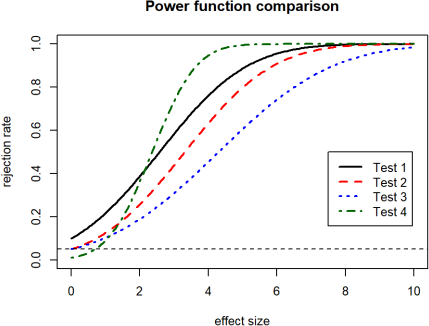
Four tests are considered to test the hypothesis H0 : θ = 0 vs H1 : θ > 0, at a significance level of α = 0.05. The power graph above gives the rejection rate of each test depending on the effect size (the true θ value). The nominal α = 0.05 value is shown with a horizontal line.
MC5: Test 2 is always better than which other test?
a. Test 2
b. Test 3
c. Test 4
d. All other tests
e. None of the other tests
MC6: Which test fails to control the type I error rate?
a. Test 1
b. Test 2
c. Test 3
d. Test 4
e. None of the tests fails
Short answer questions 4pts each
SA1
You work for a semiconductor manufacturing facility. Due to the high complexity of the manufacturing process, each chip has a 30% chance of being defective. Let X = 1 if the chip is functional, and X = 0 if the chip is defective.
a. What kind of random variable is this? Specify both the name and any necessary parameter(s).
b. Compute the expectation of this random variable. Show your work.
c. Compute the variance of this random variable. Show your work.
d. You manufacture 100 of these chips. Let Y=the number of chips that are functional. What kind of random variable is this? Again, specify the name and any necessary parameter(s).
SA2
Let X be a Poisson variable with λ = 20.
a. What is the expectation of this random variable? You may state this without computation. (Hint: think about what λ means.)
b. Give an example of an experiment that you can model using this random variable (be specific in your wording). This is an open ended question, so many correct responses are possible.
c. What is the probability of observing X = 24.5 as an outcome? Give a numeric value, and briefly explain your answer.
d. What is another random variable that you can use to approximately model a Poisson? (There are two acceptable answers here). Just the name of a variable is sufficient, no need to provide parameters.
SA3
Recall the random variable defined in homework 1, where the pdf is f(x) = 2x for 0 ≤ x ≤ 1 and 0 everywhere else. Also recall the corresponding cdf is F(x) = x2 for 0 ≤ x ≤ 1. Below is shown a plot of the pdf for
|
pdf_x = function(x) ifelse(0<=x & x<=1,2*x,0) ggplot() + geom_function(fun=pdf_x, n=1e5) + coord_fixed(ratio=.5) + theme_minimal() + xlim(c(-1,2)) + ylim(-1,3) + labs(x='x', y='PDF') |
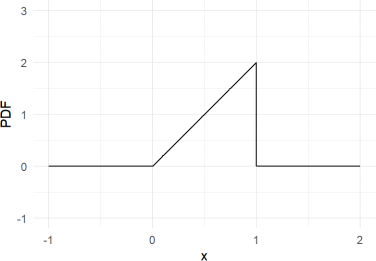
Let the functions dx , px , qx represent the pdf, cdf, and inverse cdf functions respectively for this random variable. Find the following, and make sure you show your work or write a brief explanation of your answers:
a. P(X = 0.5)
b. dx(0.5)
c. px(0.5)
d. qx(0.5)
SA4
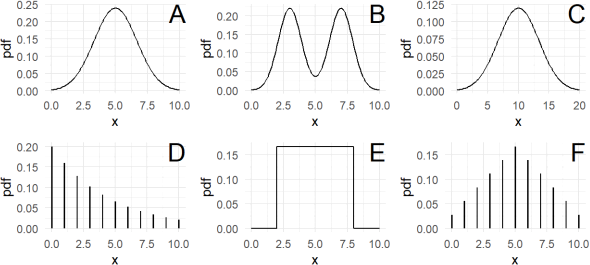
Match the following pdfs to their corresponding cdfs.
pdfs:
cdfs:
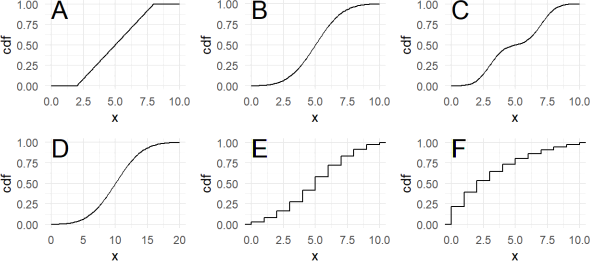
. pdf A matches cdf
![]() pdf B matches cdf
pdf B matches cdf
![]() pdf C matches cdf
pdf C matches cdf
![]() pdf D matches cdf
pdf D matches cdf
![]() pdf E matches cdf
pdf E matches cdf
. pdf F matches cdf
For this question, it’s enough just to give the correct response, but if you write a short sentence explaining your choices it may help us award partial credit.
2024-03-11