GEOL/CIEG 467/667 Ecohydrology Spring 2024 HW3: Bucket Model
Hello, dear friend, you can consult us at any time if you have any questions, add WeChat: daixieit
GEOL/CIEG 467/667 Ecohydrology
Spring 2024
HW3: Bucket Model
Upload 2 documents to the appropriate Canvas assignments:
1. Your code as an .R file to the HW3 assignment labeled CODE.
2. Your responses to questions 2 through 4 as a PDF to the HW3 assignment labeled RESPONSES.
Learning Objectives
● Develop a stochastic “bucket model” to describe soil moisture dynamics
● Experiment with and discuss how model parameterization impacts the soil moisture regime and overall water budget fluxes.
Assignment
Use R to represent all processes as discussed in class (also described by Rodriguez-Iturbe, 1999).
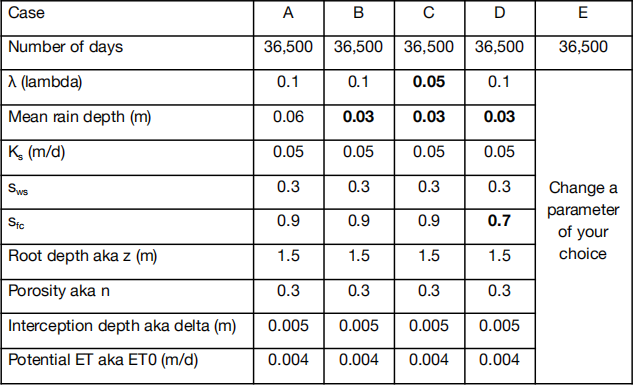
1. Create and run your model for the five cases outlined below for a 100 year (36,500 day) period. For easier identification, changes in parameters relative to Case A are bolded in the table below.
2. In words, describe how you calculated precipitation, evapotranspiration, runoff, leakage, interception, and changes in soil moisture within the root zone in your code
3. Provide the following information for each simulation above:
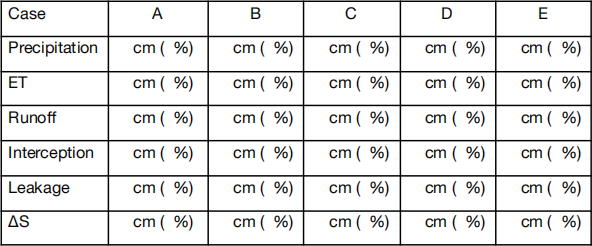
○ Fill in the table summarizing the average annual water budget:
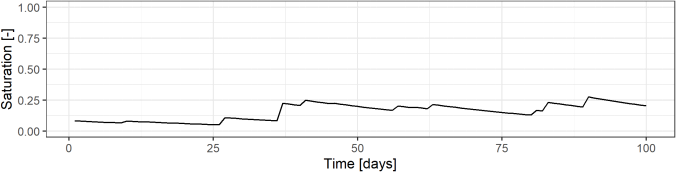
○ For each simulation, show a time series of saturation for the last 100 days of the simulation (so you are certain it is not affected by your choice of initial conditions). An example is shown below:
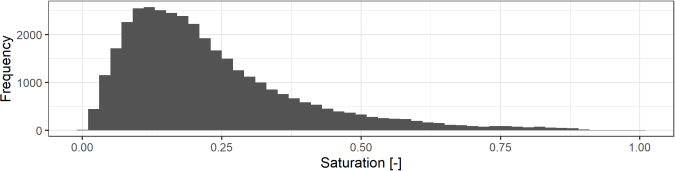
○ For each simulation, provide a histogram of saturation for the entire period excluding a 1-year warm-up period at the beginning (again, to minimize the influence of initial conditions). An example is shown below:
4. Discuss your results, linking your observations to insights into ecohydrologic processes. Your discussion should explore the following:
○ For Case A, look at a) the values/slopes/patterns of the 100-day soil moisture time series, and b) the histogram of saturation values for the entire period. What can you infer about other hydrologic processes (besides soil moisture!) in this climate from these plots? Can you estimate any parameter values from this output alone? HINT: look closely at the highest values in the time series, the different slopes in the time series, the distribution of the histogram, and any extreme values in the histogram.
○ For each of the subsequent cases, how does the parameter that was changed affect the saturation plots? How do the changes you see in saturation patterns connect with the changes you see in the overall average annual water budget? What processes cause the differences you observe?
2024-03-09