ECON 203 – Economic Statistics II Third Assignment
Hello, dear friend, you can consult us at any time if you have any questions, add WeChat: daixieit
ECON 203 – Economic Statistics II
Third Assignment
1. In this assignment, you will work with the housing.xls file. The dataset was collected from the real estate pages of the Boston Globe in 1990. These homes were sold in the Boston, MA area. There are 88 observations in the dataset and the following variables:
price house selling price, measured in $1000s
assess assessed value, measured $1000s (value before the house was sold)
bdrms number of bedrooms
lotsize size of lot in square feet
sqrft size of house in square feet
colonial = 1 if home is colonial style or = 0, otherwise
The first question consists of loading the dataset in R Studio and running some basic analysis. To load the data, you should follow the steps below:
1. Open R Studio on your computer;
2. install the package readxl. To install a package, you should use the function install.packages;
3. load the readxl library. You should use the function library;
4. define the location of the housing.xls file on your computer. Use the function setwd;
5. load the data with the function read_excel.
You can check if the data have been correctly loaded using the function head. Figure 1 shows how the code will look after following the above instructions.
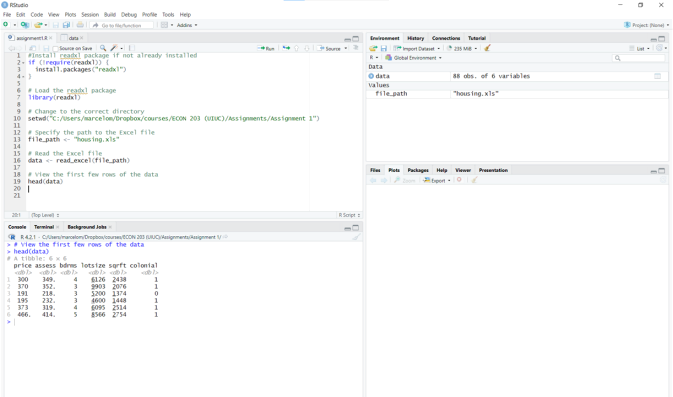
Figure 1: R studio output
Suppose that you own a real state business in the Boston area and imagine that we are back in the 1990s. Based on the dataset you have, your goal is to understand the behavior of the market.
(a) (40 points) Your first task is to plot several box plots. In descriptive statistics, a box plot is a method for graphically demonstrating the locality, spread, and skewness groups of numerical data through their quartiles. In addition to the box on a box plot, lines (called whiskers) extend from the box, indicating variability outside the upper and lower quartiles. Thus, the plot is also called the box-and-whisker plot and the box-and-whisker diagram. Outliers that differ significantly from the rest of the dataset may be plotted as individual points beyond the whiskers on the box plot.
In statistics, quartiles are quantiles that divide the number of data points into four parts, or quarters, of more or less equal size. The data must be ordered from smallest to largest to compute quartiles; as such, quartiles are a form of order statistic. The three main quartiles, resulting in four data divisions, are as follows:
The first quartile (Q1) is defined as the 25th percentile, where the lowest 25% of data is below this point. It is also known as the lower quartile. The second quartile (Q2) is the median of a data set; thus, 50% of the data lies below this point. The third quartile (Q3) is the 75th percentile, where the lowest 75% data is below this point. It is known as the upper quartile, as 75% of the data lies below this point.
In statistics and probability, quantiles are cut points dividing the range of a probability distribution into continuous intervals with equal probabilities, or dividing the observations in a sample in the same way.
Now that you know what a box plot is, you should construct the following boxplots:
1. Using the function boxplot in R, construct a box plot for house prices grouped per number of bedrooms. For example, if you want to draw a box plot for the variable A grouped according to variable B, you should use boxplot(A∼B).
2. Repeat the exercise above for colonial and non-colonial houses separately. Your R instruction should look like boxplot(A[condition== 1]∼B[condition== 1]). You should create two different box plots. One for colonial houses and another one for non-colonial houses.
3. Construct a box plot for the variable sqrf t (the house size) grouped per number of bedrooms.
4. Construct a box plot for the variable lotsize (the lot size) grouped per number of bedrooms.
(b) (20 points) A client wants to sell a house. His property has the following characteristics:
Bedrooms: 4
Lotsize: 9000
Size: 2500
Colonial: Yes
Write an instruction in R to check if you have sold any house with these features. Spoiler: you have not sold any house with these exact characteristics. However, you want to give a price range for your client. To achieve your goal, let’s do the following:
1. Construct two different box plots for prices. One for colonial four-bedroom houses with lotsize ≤ 9000 and sqrf t ≤ 2500 and a second one for colonial four-bedroom houses with lotsize > 9000 and sqrf t > 2500.
2. Construct two scatter plots. One for the prices of colonial four-bedroom houses versus the house’s size and the other one the prices of colonial four-bedroom houses versus the lot’s size.
2. The second question should be answered on Canvas.
(a) (20 points) Based on your box plots constructed in Question 1(a) we can say that (only one alternative is true):
1. Houses with five bedrooms are the ones with the lowest prices.
2. Houses with six bedrooms are the most expensive ones.
3. Among the colonial houses, the cheapest house has four bedrooms.
4. Among the non-colonial houses, the most expensive one has four bedrooms.
5. The largest houses are the ones with six bedrooms.
(b) (20 points) Based on your plots in Question 1 (b) we can say that the most adequate price range of your clients house is (only one alternative is correct):
1. Below 200,000
2. Between 200,000 and 250,000
3. Between 300,000 and 400,000
4. Between 400,000 and 500,000
5. Above 500,000
2024-03-04