Generation and Detection of DTMF signals
Hello, dear friend, you can consult us at any time if you have any questions, add WeChat: daixieit
Project Description
Generation and Detection of DTMF signals
In this project, we will study the generation and detection of dual-tone multifrequency (DTMF) signals. We will explore several different methods for detecting the DTMF signals.
The touchpads of a telephone generate and transmit DTMF signals to dial a telephone number. DTMF is a generic name given to push-button telephone signaling. When dialing a telephone number, a dual-tone multiple frequency (DTMF) signal is generated and transmitted for each key pressed. The DTMF signaling system uses two frequency tones (sinusoids) to represent the ten decimal digits (0, 1, 2, …, 9) and the characters * and #, as shown in Table 1. These standardized frequencies are chosen to avoid harmonics for ease of detection. No frequency is a multiple of another frequency, and there is no frequency that is the sum or the difference of two other frequencies.
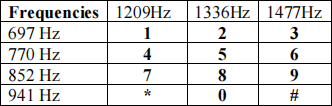
The DTMF signal for a key is generated by summing two sinusoids with frequencies corresponding to its respective column and row. For instance, when the button for number 7 is pressed, a signal that is a sum of the 852Hz and 1209Hz tones is generated, as follows:

where A represents a constant amplitude, N is the length of the DTMF in samples, fR is the row frequency, fC is the column frequency, and fs is the sampling frequency. For the purpose of this project, we will assume the sampling frequency fs = 8000 and A=1.
1. Generation of DTMF signals
We aim to generate DTMF signals using two methods:
a) The first method involves directly applying the above provided equation, which entails taking samples of sinusoidal functions. Create a function with an input of two frequencies, sampling frequency, and the duration of the DTMF in seconds. The output of the function will be samples of the DTMF signal. Ensure that the number of the generated samples is rounded to an integer.
i) Submit the MATLAB function.
ii) Test your function by generating the DTMF signal with a duration of 0.5 sec for the number ‘8’. Plot the first 200 samples of the signal using the plot command.
Note that duration will be taken 0.5 sec in all the tasks of this project.
iii) Plot the FFT of the DTMF signal in Hz. Discuss the result obtained.
b) The second method for generating the DTMF signals involves summing the output of two digital resonators. Recall that the transfer function of a digital resonator is:
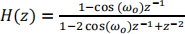
The impulse response of this digital resonator is given by h[n] = cos(ω0)u[n]. Consequently, we can generate a sinusoidal function of a digital frequency ω0 by feeding the digital resonator an impulse input signal. The digital resonator can be simulated using the MATLAB function 'filter' by formulating the difference equation derived from the above transfer function and applying an impulse signal as input (x[n] = δ[n]). In MATLAB, we can represent δ[n] as x = [1, zeros(1, N-1)]. Recall that the digital frequencies of the DTMF signal are ω01= 2πfR/fs and ω02= 2πfC/fs. Repeat tasks (i) – (iii) of procedure (a) above.
c) Write a function that takes a vector of dialed numbers as input and outputs the samples of the corresponding DTMF signals concatenated as one vector. Test your function using the input keys = [‘4’, ‘2’, ‘9’, ‘1’, ‘8’, ‘3’, ‘0’, ‘#’]. Use the sound(y, fs) to hear the dial. Does it sound familiar?
2. Detection of DTMF signals
We explore four different methods for detecting the dialed numbers from the samples of the DTMF signals. The initial step, common to all detection methods, involves dividing the received samples into segments, with each segment representing a single digit or character If fs is the sampling rate and d is the duration of each individual key, then the number of samples representing an individual key is N= round(fs × d). Thus, the received DTMF signal is divided into segments of length N.
a) Correlation method: The objective is to identify which row and column frequency exhibit the highest correlation with each segment. This is achieved by correlating the segment signal with the sine and cosine of all row and column frequencies. The character whose frequencies have the highest correlation with a segment is detected as the dialed number. The algorithm comprises the following steps, and these steps need to be repeated for each segment of the dialed signal:
- Correlate the segment with the sine and cosine functions of all the DTMF frequencies.
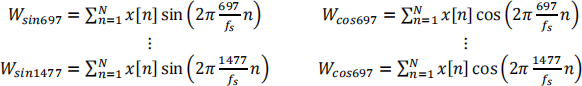
- For each frequency, find the maximum magnitude of the sine and cosine correlation values.
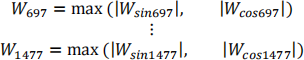
- Determine the frequency with the largest correlation value out of the row frequencies, do the same for the column frequencies.
- Determine and detect the character that corresponds to WR and WC.
b) Bandpass Filtering method:
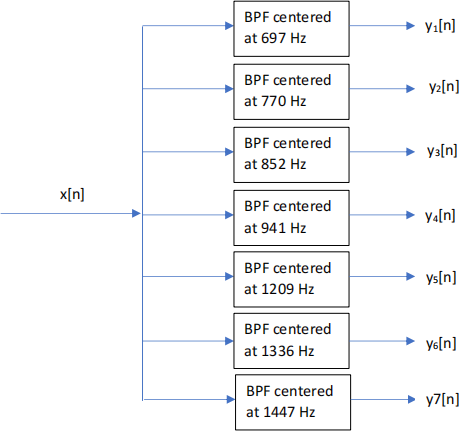
In this method, each segment of the input signal passes through a bank of bandpass filters, with central frequencies corresponding to the DTMF frequencies as depicted in the figure below. When the input to the filter bank is a DTMF signal, the outputs of two bandpass filters should be more significant than the others. Detecting these two prominent signals allows us to identify the corresponding frequencies, which are then employed as row and column pointers to determine the character from the DTMF set. A good measure of the picking the largest outputs is to determine the peak value of the output samples.
The bank of filters will be implemented using simple FIR bandpass filters having an impulse response h[n] given by

where B = 2/L , f is the row or column frequency, and L is the length of the FIR filter. For this project, we will consider L = 80.
Here are the steps of the algorithm and they must be repeated for each segment of dialed signal:
i) Find the outputs of each filter (y1[n], …, y7[n]) for the segment of DTMF signal. MATLAB filter functions can be used to determine the outputs.
ii) Determine the peak value of each output sequence:
Pk1 = max(y1[n]), Pk2 = max(y2[n]), … , Pk7 = max(y7[n])
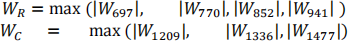
iii) Find the row frequency and column frequency with the largest peak value.
WR = max (|Pk1 |, |Pk2 |,|Pk3 |, |Pk4 | )
WC = max(|Pk5 |, |Pk6 |, |Pk7 |)
iv) Determine the character that corresponds to the frequencies that are represented by WR and WC.
c) FFT method:
After obtaining the FFT of the segment of the DTMF signal, identify the row frequency and column frequency with the largest magnitudes. Assuming X[k] is the FFT of the segment signal which is M samples long, determine the indices kj (for j=1,…, 7) that correspond for each DTMF frequency as follows:

After determining the indices corresponding to the row and column frequencies, identify the row and column frequencies with the largest magnitudes. These frequencies represent the character of the segment of the DTMF signal. Use M=2000, for this and the following method. (Since M=2000, you need to take only part of the segment signal)
WR = max (|X[k]1 |, |X[k2]|, |X[k3]|, |X[k4]| )
WC = max(|X[k5 ]|, |X[k6 ]|, |X[k7 ]|)
d) Goertzel algorithm:
The Goertzel algorithm serves as an alternative method for determining the DFT of signals, employing IIR filters to compute the necessary calculations. In comparison to direct DFT and FFT methods, the Goertzel algorithm proves more efficient when computing a small numberof spectrum points as opposed to the entire spectrum of a signal. For a detailed derivation of the Goertzel algorithm, additional resources may be consulted.
Below are the steps of the Goertzel algorithm:
i) Setup the following IIR filters for each of the 7 frequencies using the values of kj (for j=1,…, 7) obtained in the above procedure.

j=1,…, 7 and m=0,…,M. Recall that x[m] is the input signal from m=0,…, M-1 and zero pad it by x[M] = 0.
ii) Compute the output of these filters using the MATLAB filter function.
iii) Determine the magnitudes of |X[kj]|2 for each frequency using the equation below

Note that since MATLAB gives an output equal to the length of the input x[m], which extends from m=0, 1, …M-1, you may have to extend x[m] by adding one more zero sample to obtain vk[M].
iv) Find the largest |X[kj]|2 of these DFT values corresponding to the row frequencies and, similarly, do the same for DFT values corresponding to the column frequencies.
v) Select the character that corresponds to the DTMF frequencies obtained in procedure (iv).
Tasks:
i) Implement the four discussed DTMF detection methods in MATLAB and turn in the corresponding codes.
ii) Test your algorithms with the signal you generated for the keys = [‘4’, ‘2’, ‘5’, ‘9’, ‘1’, ‘5’, ‘4’, ‘#’] in procedure 1.
- Discuss whether you were able to accurately detect all the characters.
- Also, provide the following results for the first segment of the DTMF signal.
o For the correlation method: Include all the correlation outputs.
o For the bandpass filter method: Provide the peak values of the output of each filter.
o For the FFT method: Plot the magnitude of the FFT with the x-axis is labeled in Hz.
o For Goertzel algorithm: Include the values of the magnitude squares of each frequency.
iii) Load the dtmf.mat file from Canvas, and use each of your four detectors to determine the dialed keys. The dtmf.mat is generated using fs =8000 and duration of eack key =0.5 sec.
2024-03-02