BUSI2045 – Homework 1
Hello, dear friend, you can consult us at any time if you have any questions, add WeChat: daixieit
BUSI2045 - Homework 1
Note: Please include both R codes and results in your solutions. (You may use the “Compile Report” function under Menu “File” in RStudio to generate a Word/PDF report of both R codes and results)
Question 1: Data Exploration and Visualization (20 points)
Read the dataset income.csv into R and answer the below questions.
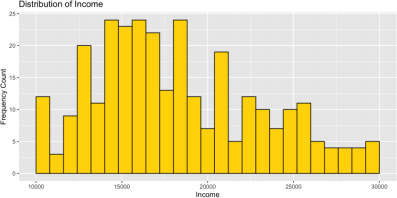
A. Visualize the distribution for variable income with a histogram, your output should be similar as the below.
Hints: (1) set binwidth as 800; (b) set the aesthetical attributes fill as “gold” and color as “black”; (3) change x andy axis labels, and then add a plot title.
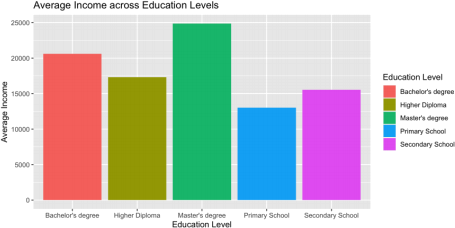
B. Create a bar plot to visualize the average income for people with different education levels, your output
should look similar as the below.
Hints: (1) visualize education levels with different colors; (2) change x andy axis labels, as well as scale name (i.e.,fill), add a plot title.
Question 2 Describe Data (40 Points)
Read the file Assignment1_Q2.csv into R and answer following questions.
A. How many observations in this data set? For each variable, what are the data types (numeric, integer, etc.)?
B. Which variable(s) are discrete? Check the unique values for all discrete variables. Which variable(s) are
continuous? Check the mean, standard deviation, and range for all continuous variables.
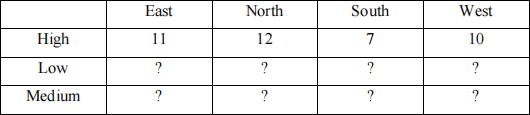
C. Construct a frequency table as below.
Hints: you may inspect the dataset to find suitable variables first. Ignore the order of the columns and rows.
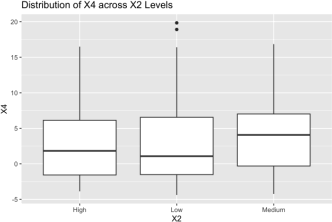
D. Create a boxplot to show the distribution of X4 across each level of X2. The result should look like the below.
What summary statistics does a boxplot visualize?
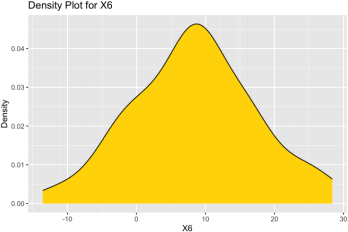
E. Construct a subset named Q2E where variable X4 only contains positive values. Then create a variable X6
which is the sum of X3 and X4 in Q2E. Visualize the distribution of X6 as below
Hints: please fill the area under the density curve with color ‘gold’.
Question 3: Describe Data (40 Points)
Read the file Assignment1_Q3.csv in R and answer the below questions.
A. Construct a subset named data_sub where the variable Income contains no missing value, i.e., noNA. How many observations and variables are in this subset?
Answer following questions based on the subset data_sub.
B. What is the maximum, 75% quantile, 25% quantile and minimum of the variable Income?
C. Write a function name ratio to compute the ratio of the interquartile range (the difference between 75% and 25% quantile) against the range (i.e., the difference between max and min value) of a variable. Then apply this function to three variables Income, NumStorePurchases and NumWebPurchases in the dataset.
Hint: you may need to create a data frame with only the three variables before using the apply()function.
D. Can you repeat step C using an anonymous function?
Hint: you should be able to receive the same result as step C.
2024-02-25