PPOL 506 – Statistics II Policy Report Proposal
Hello, dear friend, you can consult us at any time if you have any questions, add WeChat: daixieit
PPOL 506 – Statistics II
EXAMPLE
PPOL 506: Policy Report Proposal
1. State your research question. What type of research question is this? Why is it interesting to policymakers today?
RQ: How does an individual’s housing conditions affect their individual income, controlled for various other variables?
This is a complex associational research question, because we use multiple continuous variables and multiple categorical variables that contribute to our analysis. We will conduct quantitative and explanatory research to explore this research question.
This is interesting to policymakers today because as housing in the US becomes more and more inaccessible, understanding how an individual’s income might be associated with various indicators for quality/standard of living is critical to creating effective public policy. A research question that associates income and housing conditions through a multivariate regression can provide policymakers with the data to make equitable housing policy.
2. Describe the dataset you will use to answer your question. What sampling strategy was used for data collection? What population do the data represent? Why is the dataset appropriate for answering your research question?
The dataset that we will use to explore our research question is the American Housing Survey (AHS) as conducted and collected by the US Census Bureau from 2021. This survey provides information on the cost and quality of housing in the US. It is a longitudinal study of housing units across the United States, with the most recent sample being drawn in 2015 and reassessed every two years. The sampling strategy, as described by the US Census Bureau, is done through door-to-door interviews or phone calls with the homeowner or landlord. It excludes any building that is not used as a home.
The population that the data represents is the entire United States. This dataset is appropriate for answering our research question because the AHS is the most comprehensive US housing survey with a publicly available dataset. The AHS has the most up to date and applicable variables to measure our research question, as opposed to a different dataset from the US Census Bureau, such as the ACS dataset.
3. Specify the unit of analysis and number of observations in the dataset. Will you use the entire dataset or a subset of observations for your analysis?
The unit of analysis in the AHS is an individual housing unit, which could contain an individual and/or the entire family that resides in the household. This dataset contains 100,000+ observations of housing units with 3294 different variables. We will use the entire dataset for our analysis as opposed to a subset of the data, because it will provide a more accurate depiction of the entire United States population.
4. Choose 8 continuous variables you could use in your multivariate analysis. Clean these variables. Create a descriptive statistics table (with the cleaned data) that includes the mean, standard deviation, minimum, maximum, and number of observations for each variable. Write a short summary paragraph of your descriptive statistics table that argues why these variables are appropriate choices for your analysis.
This policy analysis has two main focuses of analysis: housing conditions and income level. Tabel 1 summarizes the main information of these variables. To start this investigation, we have selected 8 continuous variables, two of them are income measurement, household income and household income as a percentage of poverty threshold. We have preliminary selected two different variables to test them and then choose which one is more appropriate for the intended research. The variable householder age will work as a control variable, once we expected that this variable has important effects on income. Analyzing these data, we noticed that income seems to have a right-skewed distribution, varying from a negative minimum to outstanding $ 4.6 million as maximum, with an average value of $ 86,852.55. The same happens with household income as a percentage of poverty threshold which is on average equal to 300%, within 25% of population being in up to 135% of poverty threshold.
Table 1. Summary of continuous variables of multivariate model of association
between household income and housing conditions
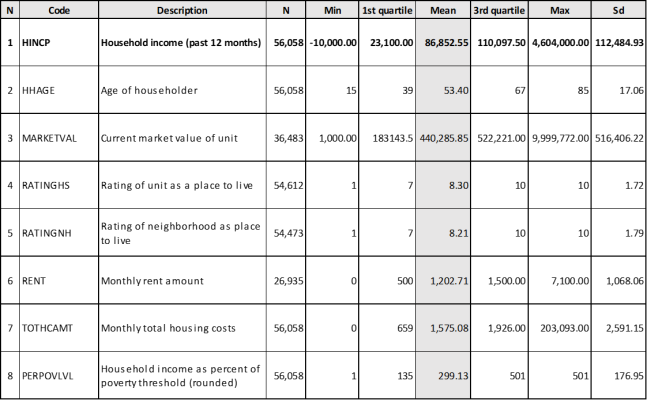
Furthermore, we have five variables which will provide information about housing conditions. We selected variables that assess from the market value of units (once more expensive units tend to be associated with more comfortable ones) to the costs of rent and other housing costs. For the expenditure on housing, we intend to analyze them in terms of income commitment. The mean rent expenditure is $ 1,202.71, these values vary from $0 to $7,100, within a standard deviation of $1,068.06. This distribution is also right skewed where more than 75% of the sample has a rent expenditure equals to $ 1,500.00 or less. The same happens with the total costs of housing and market value of property. Finally, we are using as measurement for housing conditions two rates based on the information of the householder who must have rated the unit and the neighborhood as place to live. Those values start at 1 and end at 10. The average rate for both (unit and neighborhood) are greater than 8, and more than 75% rate their own house and neighborhood with grades 7 or above.
5. Choose 4 categorical or binary variables that you could use in your analysis. Create a codebook for these variables. Write a short summary paragraph of these variables that argues why these variables are appropriate choices for your analysis. You may submit the codebook as a separate document or in a table in your write up.
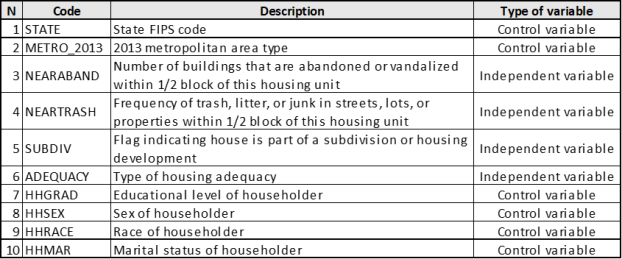
We selected 10 categorical variables to support our planned analysis, their major information is summarized in Table 2. Two categorical variables would provide extra information about neighborhood conditions; they detect if there abandoned buildings and trash within ½ block of the housing unit. The trash is responsible for an unhealth environment and can be associated with pests and related diseases while abandoned buildings can foment urban violence, such as drug dealers and other minor crimes. We also choose the variable which identifies if the house is part of a subdivision or housing development, these areas are generally associated with Real estate devaluation due to stigmatization linked to affordable housing policies. Finally, we have added 6 demographic and geographic information to work as control variables in our model. Further information is available in the codebook available in the appendix section.
Table 2. Summary of categorical variables of multivariate model of association between
household income and housing conditions
6. Write a sample multivariate regression model. Specify your outcome (Y) variable and your explanatory (X) variables. Clearly state your hypotheses for the direction of the effect of each explanatory variable.
In order to understand the relationship between housing conditions and income levels in USA we will use a multivariate model where the dependent variable is the household income, and the independent variables are a set of information that allow us to determine the housing conditions of individuals. Our hypothesis is that precarious housing conditions are associated with lower income levels. Additionally, we will include in the model some control variables in order to outline other factors which are evidence of association with income (like race and gender). Figure 1 briefly illustrates the role of each variable in this model.
Figure 1. Graphic explanation of multivariate model of association between household income and housing conditions
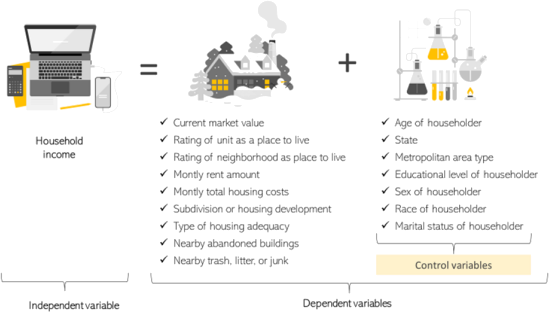
In other words, we are planning to work with a model drawn as below:
Y = α + β1 x1 + β2 x2 + β3 x3 + β4 x4 + β5 x5 + β6 x6 + β7x7 + β8 x8 + β9 x9 +
β10 x10+ β11 x11 + β12 x12 + β13 x13 + β14 x14 + β15 x15 + β16 x16
Where...
Y = Household income (past 12 months)
x1 = Current market value of unit
x2 = Rating of unit as a place to live
x3 = Rating of neighborhood as place to live
x4 = Monthly rent amount in terms of income commitment [rent/(hhinc/12)]
x5 = Monthly total housing costs in terms of income commitment [tothcamt/(hhinc/12)]
x6 = Number of buildings that are abandoned or vandalized within 1/2 block of this housing unit
x7 = Frequency of trash, litter, or junk in streets, lots, or properties within 1/2 block of this housing unit
x8 = Flag indicating house is part of a subdivision or housing development
x9 = Type of housing adequacy
x10 = State
x11 = Metropolitan area type
x12 = Age of householder
x13 = Educational level of householder
x14 = Sex of householder
x15 = Race of householder
x16 = Marital status of householder
In summary our hypothesis test is:
H0: β1 , β2 , β3 , … , β16 = 0
H1: β1 , β2 , β3 , … , β16 ≠ 0
Why is it a relevant issue?
According to the National Low Income Housing Coalition, 6.8 million more affordable housing units are needed for extremely low-income families in USA. Some researchers have defined housing affordability as a major crisis when the pandemic and recession hit. Since 1934 with the National Housing Act, the country has invested important efforts on addressing housing insecurity, unfortunately, even with a large path of policy intervention, just 35% of extremely low-income U.S. citizen can rely on available and affordable households.
A full-time job (or two) might not be enough for a family to afford a decent place to live. Nowhere in the U.S. can a worker earning the federal or prevailing state minimum wage rent a two-bedroom apartment without having to pay more than 30% of their income. In fact, a minimum wage worker must clock nearly 127 hours per week, more than three full-time jobs, to afford a two-bedroom rental, or 103 hours per week, more than 2.5 full-time jobs, to afford a one-bedroom, according to the National Low Income Housing Coalition (NU-Habitat3).
According to Harvard University’s Joint Center for Housing Studies, 31.5% of all households (nearly 38 million American households) are expending more than 30% of their incomes on housing, leading them to maintain a nearly impossible balance to attend their other minimum needs such as alimentation, transportation and health. Another US housing issue is the overcrowded households, which means houses with large number of people living per room, what represents mainly risks of health to these people. In summary, even with all governmental efforts to address housing insecurity in USA, it is still a large and complex path to go through until it is finally solved. Under this sense, understanding how income and housing conditions are associated has become more relevant nowadays.
7. Find a journal article that uses the data you used in this proposal. Write a two-paragraph summary of the article that focuses on the research question, data, variable constructs, and main analysis. Include 2-3 sentences explaining the policy-relevance of the application. .
Desmond, M. (2015, March). Unaffordable America: Poverty, housing, and eviction. Fast Focus - University of Wisconsin–Madison. Retrieved February 5, 2023, from https://www.irp.wisc.edu/publications/fastfocus/pdfs/FF22-2015.pdf
A journal article that utilizes the AHS dataset comes from the Insitute for Research on Poverty from the University of Wisconsin-Madison titled Unaffordable America: Poverty, Housing, and Eviction published by Matthew Desmond in March 2015. This article explains how families with low-income devote around half of their monthly income to housing, all while housing costs rise, wages decrease, and government assistance disappears. In addition, the article associates these factors to other demographics, such as gender, race, and number of children. The main research question of the article can be understood to be, “What is the relationship between eviction in America and indicators for living in poverty, and the demographic characteristics of those effected by eviction?”.
The data used in this article comes from the 1991-2013 AHS, highlighting variables that assess the percentage of income spent on housing, the percentage of renting households below the poverty line, distribution of housing assistance, percentage of evictions in the past two years, utility costs, and various demographic variables such as gender, race, number of children, geographic location, and mental health status. The main analysis of the article highlights the relationships between some of these variables, including percentage of income spent on housing and percentage below the poverty line, distribution of housing assistance among working families, and race/ethnicity of renters and number of evictions in the past two years.
Lastly, the author of the article discusses the policy implications of the data from the AHS. The author suggests an expansion of federal housing assistance to families who experience a sudden loss of income, the providing of housing-specific lawyers to those who are evicted and must attend housing court. Above all else, however, the author insists that America must move towards providing “stable, safe, and affordable housing” in all future policy. These policy suggestions are all highly relevant to our main research question outlined in this proposal.
Appendix – Codebook – Categorical variables

2024-02-24