PPOL 506: Midterm Review
Hello, dear friend, you can consult us at any time if you have any questions, add WeChat: daixieit
PPOL 506: Midterm Review
1. This output reports the results of a regression of child’s birthweight in grams on sex, race/ethnicity (1=white, 2=black, 3=Mexican-American), mother’s education (in years), and mother’s age (in years).
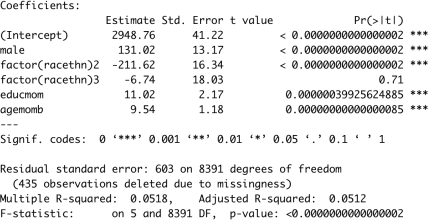
a. What is the unit of observation for this model?
b. What is the sample size for this regression?
c. For each explanatory and outcome variable, state the variables name (the variable name of the outcome is birthwt), provide a brief definition, and specify the units. For indicator/categorical variables, state what each value of the variable means.
d. What is the regression model? And why is the category White is omitted in the regression model?
e. Write the prediction equation using the regression output.
f. What is the predicted birthweight for a black, male infant born to a 26-year-old mother with a bachelor’s degree (i.e., 16 years of education)?
g. For each explanatory variable, interpret the estimated coefficient.
h. Interpret the intercept.
i. Conduct a test of global significance of this model. State your hypotheses, calculate the test statistic, and draw a conclusion. Assume α = 0.05.
j. Conduct a hypothesis test for the estimated effect of mother’s education. Specify the hypotheses you are testing, calculate the test statistic, and draw a conclusion. Assume α = 0.05.
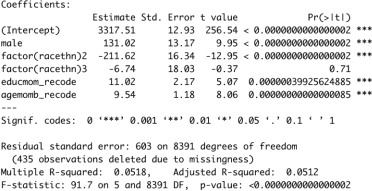
k. The updated regression results recode the variables educmom and agemomb to center them at the variable means. Interpret the intercept in this regression. How does it differ from the intercept calculated in part (f)?
2. We are interested in knowing if mean individual income varies by marital status. You have a dataset that contains information on individual income and a categorical variable called maritalstat where 1=married, 2=never married, and 3=formerly married. You may assume α = 0.05.
a. Write the hypotheses you will test.
b. The following output is from regressing wage income on an indicator for married.
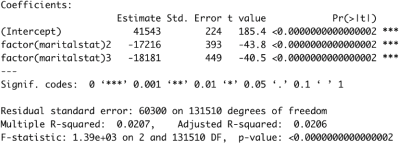
i. What are the estimates for μmarried, μnonmarried, and formallymarried?
ii. Rewrite your hypotheses from step (a) using the regression coefficients.
iii. Test the hypothesis from (b.ii).
c. Construct a 95% confidence interval for the difference in mean incomes among married (n = 72494) and never married (n = 34995) individuals. Interpret.
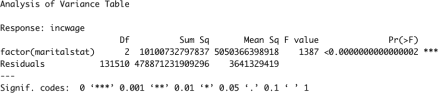
d. Test this hypothesis using the one-way ANOVA results. Calculate the test statistic and draw a conclusion. Hint: If you do not have enough information to draw a conclusion, state what you would need in order to do so.
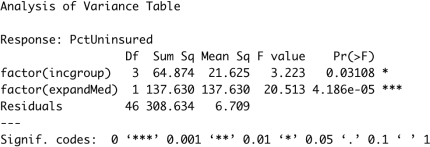
3. We are interested in comparing the mean uninsured percentage in states across categories of income group and Medicaid expansion. We have a data set with the variables PctUninsured (percent of the state without insurance), incgroup (categorical variable that is increasing in income; takes values 1, 2, 3, or 4), and expandMed (indicator for expanded Medicaid). Assume α = 0.05.
a. Using the two-way ANOVA output provided, test the hypothesis that mean uninsured percentage is the same in states with that expanded Medicaid and those that did not, controlling for income group. State the hypotheses, calculate the test statistic, and draw a conclusion.
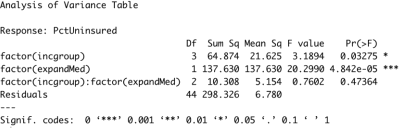
b. We think that there might be an interaction effect of income group and Medicaid expansion on the percent uninsured. Using the two-way ANOVA with interaction output provided, test this hypothesis. State the hypotheses, calculate the test statistic, and draw a conclusion.
4. We are interested in determinants of state median income. The following is regression output from two models in R. The variable College is an indicator that at least 30% of the state population has a college degree. The variable Republican 2016 is an indicator that the Republican candidate won the state in 2016.
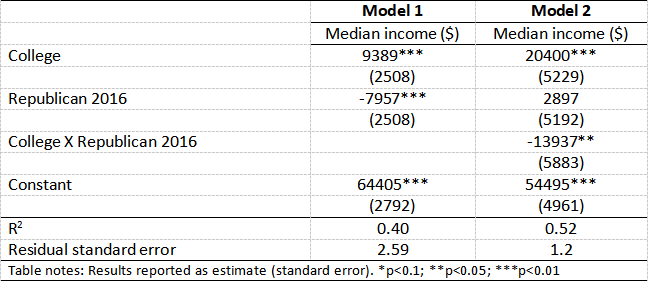
a. Using model 1, interpret both coefficients.
b. Using model 2, interpret both coefficients and the interaction term.
c. Is the interaction term important in this model?
5. Regressing income ($) on age, education (indicator for high school diploma or above), sex (1=male, 2=female), and the interaction of education and sex returns the following regression results.
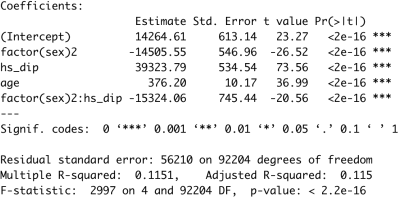
a. What is the prediction equation for women? Men?
b. What is the effect of a high school diploma on income for women? Men?
2024-02-22