Stat 466/866 Assignment 2
Hello, dear friend, you can consult us at any time if you have any questions, add WeChat: daixieit
Stat 466/866, Fall 2021
Assignment 2
Note: For this assignment, you again only need to submit your SAS program file. Use internal comments to identify the question numbers and respond to questions. Please ensure your SAS program file is executable. Use variable lists and arrays to reduce your code were practical.
1. Put your name in a title so that if the entire assignment is executed, your name will appear above all output. For each question, add a secondary title providing the overall question number.
2. This question requires you to use the SAS data step with probability functions to calculate all probabilities. Use proc print with observation numbers suppressed to display all results.
a. Suppose this Halloween a child who loves potato chips goes trick-or-treating to 10 random homes in Kingston. Suppose that 1 in 4 homes gives out a bag of chips. Assume that the number of bags of chips the child gets follows a binomial distribution with 10 trials and a success probability of 0.25.
i. Calculate and display the probability that the child gets 2 or more bags of chips.
ii. Use a do loop to generate a dataset with 11 rows and 2 columns (variables) named Chips and Prob . Chips should be 0 for the first row, 1 for the 2nd row, 2 for the 3rd row and so on. Prob is the probability that the child gets the exact number bags of chips as indicated by the Chips column.
b. Suppose that the number of trick-or-treaters that visit your house follows a Poisson distribution with a mean of 10.
i. Calculate and display the probability that more than 12 trick or treaters will visit your house this year.
ii. If you give each trick-or-treater one chocolate bar, what’s the minimum number of chocolate bars you need to buy to be at least 95% certain that you won’t run out of chocolate bars this Halloween. Use a function that returns this number.
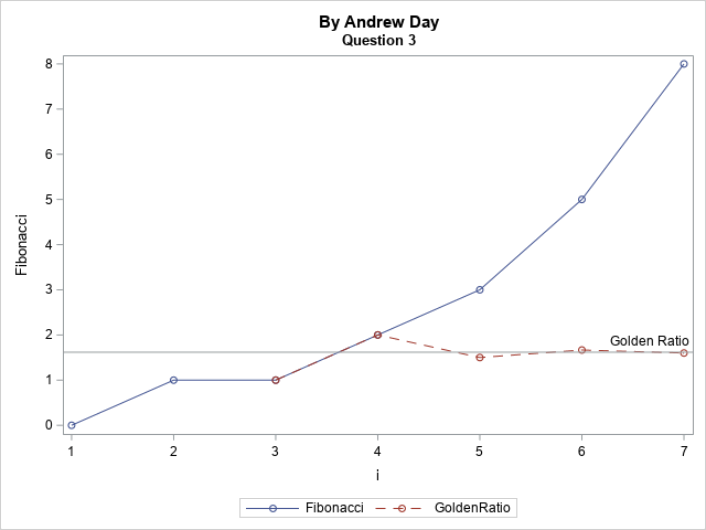
3. Fun with Fibonacci
The Fibonacci sequence is one of the most famous sequences in nature and mathematics. If you are not familiar with it look it up. The first and second elements of the Fibonacci sequence are 0 and 1 (some references consider 1 the first element). Each additional element is the sum of the prior two elements, so element 3 is 0+1=1, element 4 is 1+1=2, element 5 is 1+2=3 and so on.
The ratio of an element in the Fibonacci sequence divided by the prior element in the sequence converges to a number called the ‘Golden Ratio’. The Golden Ratio is quite remarkable in mathematics, nature, art and architecture (again look it up if you are not familiar with it). The golden ratio is equal to  (approximately 1.61803).
In a single data step, generate a data set containing one row and variables F1 through F20 containing the first 20 elements of the Fibonacci sequence. Also create variables GR1 though GR20 where GRi is equal to Fi/Fi-1. GR1 and GR2 are undefined so they will be left as missing. Do this question by using arrays. You will assign F1 and F2 the values of 0 and 1 respectively, but the remaining elements of the arrays can be calculating by using arrays to apply the Fibonacci and Golden ratio formulae
The remainder is for STAT 866 only:
The dataset you just created contains only 1 row with different variables containing the elements of the sequences. Create another dataset that contains only 3 variables named i, Fibonacci and GoldenRatio and has 1 row for each of the first 20 elements of Fibonacci sequence. Use this dataset to create the figure shown below. Note that only the first 7 elements are displayed, and the y-axis ranges from 0 to 8 in increments of 1. Also notice the labelled reference line at 1.61803 and the dashed Golden Ratio Estimate.
4. Simulating and Assessing Distributions.
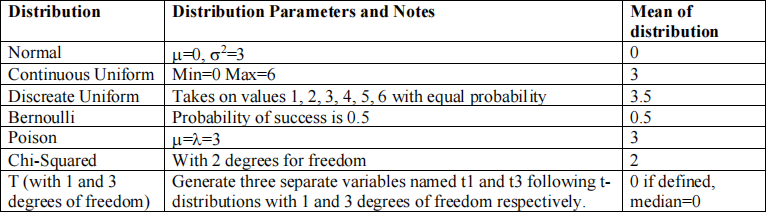
a) In a single data step generate a data set named samples containing 200, 000 rows with 8 variables containing random numbers from the 8 distributions described in table 1 below. Generate these rows using a double do loop with an outer index variable named sample that increments from 1 to 10,000 and an inner index variable named n which increments from 1 to 20. You will need to look up the rand function to generate the 8 random variables. Set the seed to 1234 so we all generate the same “random” sample.
Table 1:
b) Run each of these 8 variables through a single procedure that will provide detail univariate descriptive statistics including histograms and other plots of the distributions. Have the procedure add a kernel smooth and normal density reference curve to the histograms.
c) Now run each of these random variables through PROC MEANS to create a new dataset named averages that contains the average, variance and 95% confidence limits for each variable in each of the 10,000 samples of size 20. Tell the procedure not to display any results (or this will take forever to run). This procedure will read in the 200,000 rows of the 8 random variables and will generate a dataset with 10,000 rows (one for each sample). For each distribution, the output data set should contain one variable containing the mean, one variable containing the variance, one variable containing the lower confidence limit and another variable containing the upper confidence limit. I don’t care if the dataset contains some additional variables. If possible, use an option so that SAS will automatically name the output variables by combining the input variable name with the statistic name.
d) Run the 10,000 sample averages generated in c through the same procedure with the same options as use used in part b. Look at the results including the histogram. Do any of these averages appear approximately normal? Which one(s)? In a comment, refer to at least two results from the procedure output to support your response for each random variable.
e) Now read the dataset you created in c) into a new data step to create 8 new variables (one for each distribution) containing the value 1 if the true mean is contained within the normal approximate 95% sample confidence limits and 0 otherwise. Create 8 additional variables that contain the width of the 95% confidence intervals for each distribution.
f) Use PROC MEANS step to display the coverage rates of the 95% confidence intervals and the widths of each confidence interval for each distribution. Have this PROC MEANS only display two decimals. If the coverage rate rounds to between 0.94 and 0.96 inclusive consider the coverage rate nominal. If the coverage rate rounds to >0.96 consider it conservative and if it is <0.94 consider it anti-conservative. In a comment, tell me which distributions had a nominal coverage rate with a sample size of 20.
g) Don’t provide the code for this, but re-estimate the coverage rates for a sample size of 3 instead of 20. In a comment, list the distributions that maintained their nominal coverage rate with a sample size of 3. When running the coverage simulation with n=3, did you notice any sign of a problem in the log? Don’t worry about fixing anything, just comment if you log suggested any issues.
h) For STAT 866 only: Do you think the sample means would approach normality, and the coverage rates would become nominal for all 8 distributions, if we made the sample size large enough? Why or why not?
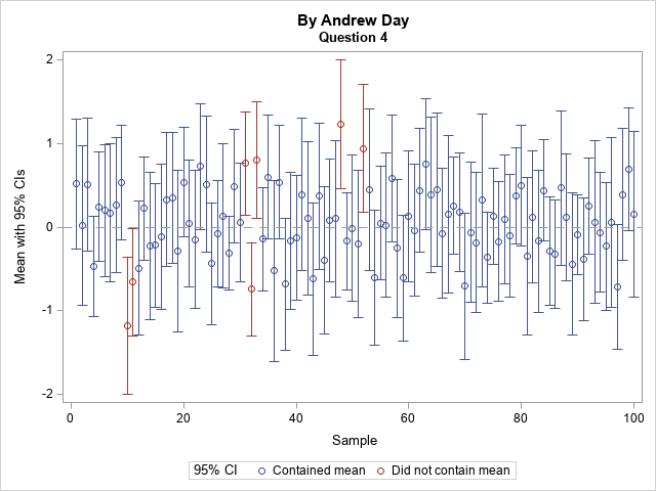
i) For STAT 466 only. The figure below shows the mean (circle) and 95% confidence interval for the first 100 simulated samples of size 20 from the normal distribution with mean 0 and variance=3. Try to generate the exact same figure with the same axis labels and legend. Notice the dashed reference line at 0 and the different color of the of the 95% confidence intervals not containing the true mean.
j) For STAT 866 only. Try to generate the 95% CI coverage indicator variables for the 8 distributions listed in table 1 in a single data step. That is, you are redoing most of the work done in parts a, c and e in s single data step. Have the resulting dataset contain 10, 000 rows (simulations) each providing the coverage rate for a sample size of 100. Hint: this should make extensive use of arrays and variable lists.
Figure required for STAT866 only:
2021-10-26