ELEC402 Power Systems Analysis and Dynamics
Hello, dear friend, you can consult us at any time if you have any questions, add WeChat: daixieit
ELEC402-CW-01-03
ELEC402
Power Systems
Analysis and Dynamics
Coursework
1. Introduction
The coursework for the ELEC402 – Power Systems Analysis and Dynamics module is worth 30% of the overall module grade. It has two parts:
. The first part (30%) asks you to build a 13-bus system (single-line diagram) in PowerWorld Simulator and perform simple power flow and fault studies to analyse the network.
. The second part (70%) asks you to integrate additional renewable generation into an existing network, without exceeding the constraints on the system.
In total, there are 4 tasks, with 2 tasks in first part and 2 tasks in second part.
After completing the coursework you should be able to:
1. Use PowerWorld simulator to build networks, and conduct power flow analysis and fault studies.
2. Explain the need for power flow analysis and system fault studies and the processes involved in completing them.
3. Describe and explain how distributed generation affects the system loading, voltage levels and fault currents.
Note 1: To complete the coursework you need to install PowerWorld simulator on your own
Windows PC. Files and installation instructions can be found on the module’s CANVAS webspace.
Note 2: Before attempting the Coursework it is advised to watch the PowerWorld simulator tutorials. These are available on the module’s CANVAS webspace.
Note 3: Submission of the Coursework is electronic, through CANVAS. Submission
instructions and deadlines can be found on the module’s CANVAS webspace.
Note 4: Avoid any form of plagiarism. Submissions will be checked with Turnitin.
2. System Power Flow Analysis and Fault Study [30%]
For any power system, power flow calculations are essential since they provide the information required to optimise the network design, determine the voltage profiles at each busbar, determine the required transformer tap settings, etc. Power flow calculations are usually the first step taken to analyse the behaviour of a power system. Fault studies are also of importance. They can inform power system equipment specifications such as the rating of circuit breakers.
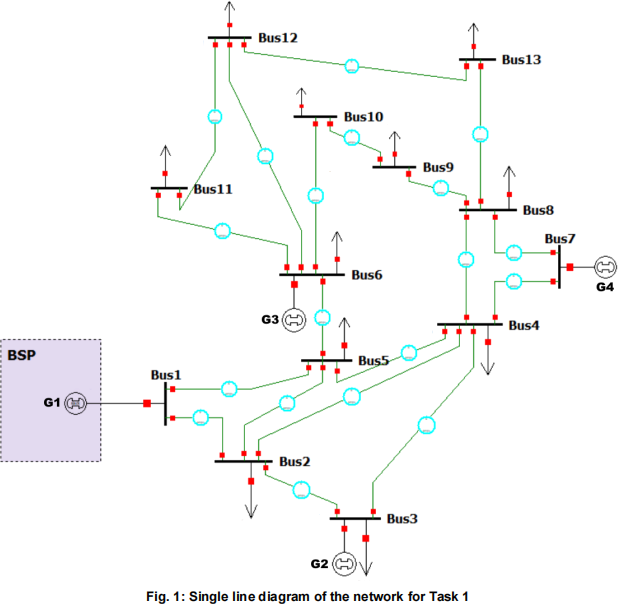
Consider the distribution network Fig. 1. This network is mainly fed by a bulk supply point (BSP), represented by the Generator connected to Busbar 1. Additional generators are connected to the system for extra support.
2.1. Task 1 [15 marks]
|
Build the network shown inFig. 1in PowerWorld Simulator. The data for the network are provided in Tables 1, 2 and 3. |
Notes:
1. Download the Case file and Single Line Diagram file from CANVAS and complete the
network. The BSP and Bus1 are already provided.
2. Bus1 is the System Slack Bus.
3. Transmission lines have no MVA limits.
|
Once you are confident that your network is accurately modelled, upload the PowerWorld Simulator Case file and Single Line Diagram file to CANVAS. |
2.2. Task 2 [15 marks]
|
TASK Run a power flow analysis (Newton) on the network you have built for Task 1. Record the voltage magnitude in per unit and the voltage angle in degrees at each bus in the system. All values should be stated to three decimal places, e.g. 0.987 p.u., 6.543°. Include the (-) sign where appropriate. |
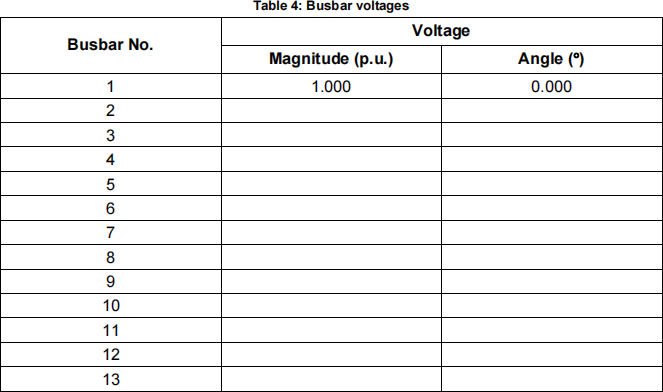
|
TASK
Apply a 3-phase balanced fault to each Busbar in the network ( Tools àFault Analysis). The fault resistance and reactance should both be 0.01 p.u. in all cases. Record the fault current in Amperes at each bus. All values should be stated to the nearest Ampere.
|
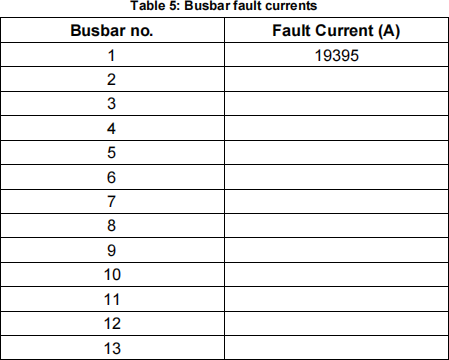
|
UPLOAD Go to CANVAS and enter the values from Tables 4 and 5 by answering the quiz for Task 2. You will be randomly asked for some of the values from each table. |
3. Distributed Generation Integration Study [70%]
Consider the distribution network, Area 1, shown in Fig. 2 (this is different to the network in Section2). Area 1 is connected to another network, Area 2, represented by the generator connected to Busbar 13. Electrical power can be exchanged between the two Areas. Due to government incentives and subsidies, the system operator wants to integrate as much renewable generation as possible into Area 1. However, the network must still operate under its existing constraints. Hence, all voltages should be within ± 5% of nominal values, i.e. 0.95 – 1.05 p.u., and the power system equipment (lines, transformer) should not be overloaded.
Although renewable generation is usually connected to the network using Power Electronic Converters (PECs) there is no requirement to model them in this study. Capacity limits for the lines and transformer have been included in the network model. Due to planning restrictions, Busbar 1 and Busbar 13 are not available for additional renewable generation integration.
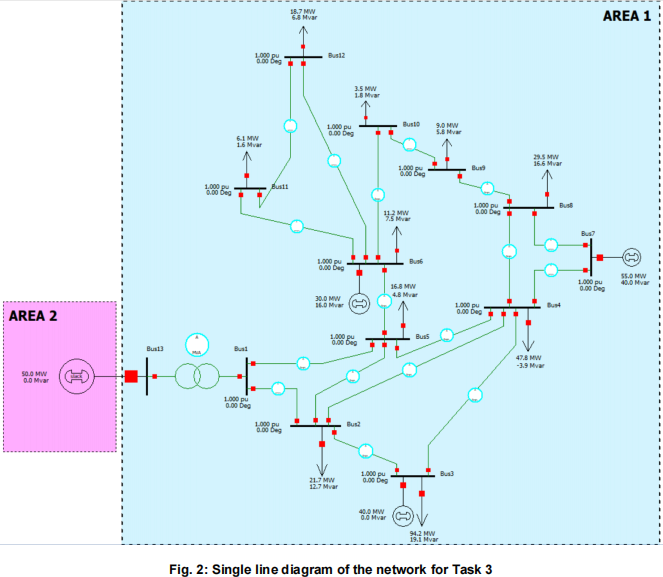
3.1. Task 3 [30 marks]
|
TASK Excluding Busbar 1 and Busbar 13, identify the three best locations (busbars) in the network in order to add the maximum amount of renewable generation without exceeding the system constraints. The distributed generation should operate with unity power factor. Use Table 6 to record the locations and additional active power added at each location. Power values should be stated to the nearest MW. |
Notes:
1. The Case file and Single Line Diagram file for the network inFig. 2 are available in CANVAS.
2. Do not change any of the network parameters already provided in the source files.
3. For simplicity, you can represent the three additional distributed generation sources as synchronous generators connected to the chosen busbars. Make sure that the “Available for AGC” and “Available for AVR” options for these generators are not active.
4. Arriving at the optimal solution will involve trial and error. You will have to use your knowledge of power systems and try different combinations of locations and power outputs.
Table 6: Additional renewable generation
|
Active Power Added (MW) |
|
|
|
|
|
|
|
|
|
|
|
Total: |
|
|
UPLOAD
Go to CANVAS and enter the locations (bus numbers only) and the active power added (to the nearest MW) by answering the quiz for Task 3.
|
3.2. Task 4 [40 marks]
|
Produce a short report that details your solution to Task 3, the impact this has on the network, and the implications of adding renewable generation. |
Notes:
1. Download the template for the report from CANVAS. Do not adjust paragraph spacing or font size. Your report should be two pages in length.
2. The first page should include a written summary of the work completed in Task 3. You should include the following:
. Short description of the solution and the reasoning for placing the additional generation at the chosen locations.
. The impact of the additional generation on the network.
3. The first page should also include a short discussion regarding the implications of interfacing renewable generation using power electronic converters (PECs) in real power networks. This will involve a brief research of associated literature.
4. The second page should only contain a screen shot of the modified network, i.e. including the additional generators, following a power flow solution, including all power flows and system busbar voltages. This must be clearly legible.
|
UPLOAD Upload your two-page report to CANVAS (preferably in .pdf format). |
2024-02-03