ECON 203 – Economic Statistics II
Hello, dear friend, you can consult us at any time if you have any questions, add WeChat: daixieit
ECON 203 – Economic Statistics II
1. In this assignment, you will work with the housing.xls file. The dataset was collected from the real estate pages of the Boston Globe during 1990. These homes were sold in the Boston, MA area. There are 88 observations in the dataset and the following variables:
price house selling price, measured in $1000s
assess assessed value, measured $1000s (value before the house was sold)
bdrms number of bedrooms
lotsize size of lot in square feet
sqrft size of house in square feet
colonial = 1 if home is colonial style or = 0, otherwise
The first question consists of loading the dataset in R Studio and running some basic analysis. To load the data, you should follow the steps below:
1. Open R Studio on your computer;
2. install the package readxl. To install a package, you should use the function install.packages;
3. load the readxl library. You should use the function library;
4. define the location of the housing.xls file on your computer. Use the function setwd; 5. load the data with the function read_excel.
You can check if the data have been correctly loaded using the function head. Figure 1 shows how the code will look after following the above instructions.
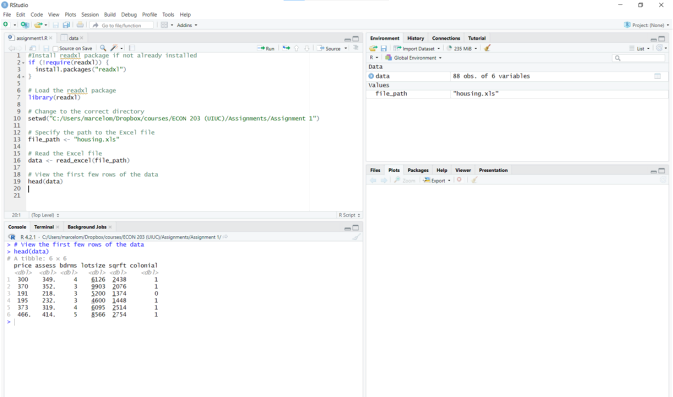
Figure 1: R studio output
(a) (5 points) Plot a histogram of the variable price. You should use the function hist. You can type help(hist) to learn the function’s syntax. Change the X-axis label to “price in thousands of dollars.”
(b) (5 points) Make a scatter plot of the variable price on they-axis against the variable sqrft on the x-axis. Change the x-axis andy-axis labels to “size of the house in square feet” and “price in thousands of dollars,” respectively. You should use the function plot. You can type help(plot) to learn the function’s syntax.
(c) (5 points) Repeat the item above with price on the y-axis and the variable lotsize on the x-axis. Change the x-axis and y-axis labels to “size of the lot in square feet” and “price in thousands of dollars,” respectively.
(d) (5 points) Repeat the item above with price on the y-axis and the variable bdrms on the x-axis. Change the x-axis and y-axis labels to “number of bedrooms” and “price in thousands of dollars,” respectively.
(e) (5 points) Repeat the item above with price on the y-axis and the variable assess on the x-axis. Change the x-axis and y-axis labels to “assessed price in thousands of dollars” and “price in thousands of dollars,” respectively. Now, you should plot a 45-degree line on the same scatter plot. Use the function abline
(f) (5 points) Plot two histograms. One for the prices of the colonial houses and another for all the other houses. You can define variables data$price[data$colonial == 1] and data$price[data$colonial == 0]
(g) (5 points) Use the function summary to obtain the descriptive statistics for the variables in the dataset.
(h) (5 points) Use the function sd to obtain the descriptive statistics for the variables in the dataset.
2. The second question should be answered directly on Canvas.
Please indicate if each statement is TRUE or FALSE.
(a) (5 points) The distribution of prices in the sample is symmetric.
(b) (5 points) The price average in the dataset is 265.500 dollars.
(c) (5 points) The price average in the dataset is smaller than the median price.
(d) (5 points) The integer part of the price standard deviation in the dataset is 102.
3. The third question should be answered directly on Canvas.
Please indicate if each statement is TRUE or FALSE.
(a) (5 points) From the scatter plot of price against sqrft, we can say that the relation between prices and the house size seems to be quadratic.
(b) (5 points) From the scatter plot of price against lotsize, we can say that there is one
outlier observation (a house with a very large lot size).
(c) (5 points) Most houses have 3 or 4 bedrooms.
(d) (5 points) Assessed prices are usually smaller than the selling prices.
4. The fourth question should be answered directly on Canvas.
Please indicate if each statement is TRUE or FALSE.
(a) (5 points) Colonial houses are more expensive than non-colonial houses.
(b) (5 points) The price variance of colonial houses is smaller than the non-colonial ones.
(c) (5 points) The price distribution of colonial houses is very different from that of non- colonial ones.
(d) (5 points) On average, colonial houses have more bedrooms than non-colonial ones.
2024-01-31