FV2204 Computational Engineering Assignment Brief No.1 (2023 – 2024)
Hello, dear friend, you can consult us at any time if you have any questions, add WeChat: daixieit
FV2204 Computational Engineering
Assignment Brief No.1 (2023 – 2024)
The work shall be typed or word-processed in your own words. The deadline for submission is 11:59 p.m. (HKT) on 08 Mar 2024 (Friday).
Learning Outcomes
This piece of assessment will test your ability to meet learning outcomes as described hereunder:
. Use and apply Scilab to plot graphs of functions given both analytically and by the data from text files. Incorporate those graphs into reports electronically (Learning Outcome 1)
. Apply standard numerical methods of computational engineering, e.g. curve fitting and interpolation, solution of simultaneous linear equations, and statistical processing of experimental data (Learning Outcome 2)
. Write Scilab scripts and function to carry out engineering computations and plot complex graphs (Learning Outcome 3)
. Demonstrate the use of problem solution tools and evaluative skills in the selection of appropriate methods of analysis (Learning Outcome 4)
Assignment Details
This assignment contains 4 questions. Answer all questions with words not exceeding 2,500. All the assumptions, comments in the scripts and explanation in your answers should be clearly stated due to be awarded. The assignment will carry 50% weighting of the total mark of this module.
Submission Details
(1) The deadline for submission is 11:59 p.m. (HKT) on 08 Mar 2024 (Friday). Late
submission will be dealt with strictly in accordance with UCLan Regulations.
(2) The script files for both Scilab (*.sce) and CFAST (*.IN) and captured screenshots to demonstrate the output results shall be included in the submission.
(3) No hard copy is required to be submitted to the SCOPE counter. This assignment should be submitted through Turnitinto CityU SCOPE CANVAS assignment submission folder.
(4) In-text citations and referenced publications shall be added to the answer to each question.
(5) Using AI-generated text to complete your assignment is prohibited. Citation of Harvard style shall be used for all quoted references. UCLan regards any use of unfair means in an attempt to enhance performance or to influence the standard of award obtained as a serious academic and/or disciplinary offence.
(6) Submission of written assignment shall be type-written in .pdfor .docx format. The file name of your submission shall follow the format as the example below:
FVxxx_CHAN Tai Man_G12345678
(7) Students should do whatever means to make sure the files are duly submitted via the CANVAS system and check whether the work is successfully uploaded (by downloading the file from CANVAS again). All claims on technical problem without strong evidence for unsuccessful uploading shall not be accepted.
(8) It should be the students’ responsibility to double-check the readability (pdf or docx format) of the submitted files.
(9) Administration team will not remove or replace student’s submitted assignment in
CANVAS or help students to upload the soft copy of his/her assignments to CANVAS.
Q1. (Learning Outcome 1) Use and apply Scilab to plot graphs of functions given the set of parametric equations for −20π ≤ t ≤ 20π:
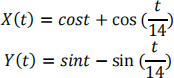
You are required to write a scilab function with the header plot_Q1(t) which could allow the input of variable t which has been digitalized by taking its starting value, ending value and number of desired points that evenly divide the interval. The defined function plot_Q1(t) shall create the following plots with appropriate labels on the same figure window:
(a) X(t) occupied the top left corner of the figure window
(b) Y(t) occupied the top right corner of the figure window
(c) Y(X) plotted at the bottom of the figure window
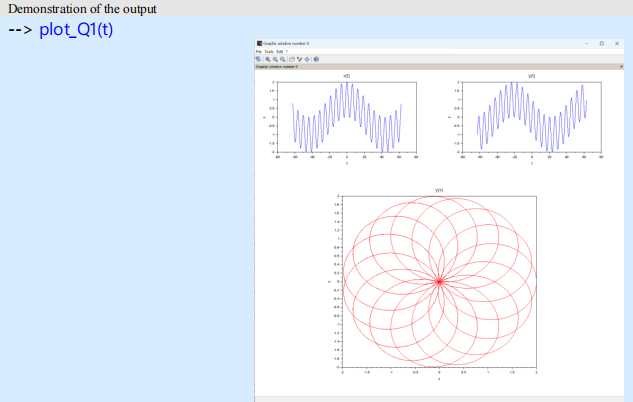
Q2. (Learning Outcome 2) Use Scilab to read the heat release rate stored in the file named as “Q2_heat release rate.csv” which contains the measured heat release rate for full- scale upholstered chair from the four selected fire tests. Please download the csv file from the “Assignment Brief” folder at the course Canvas.
You are required to write a Scilab function with the header avg_peak_hrr = read_hrr(input_filename) which could read the input of the full path of the csv file stored at your local hard disk. The defined function read_hrr shall be able to:
(1) Plot the heat release rate curve of the 4 fire tests for the upholster chair side-by- side on the same figure with appropriate labels;
(2) Indicate the peak heat release rate and the time to peak heat release rate for each test; and
(3) Calculate the averaged peak heat release rate avg_peak_hrr from the four selected fire tests
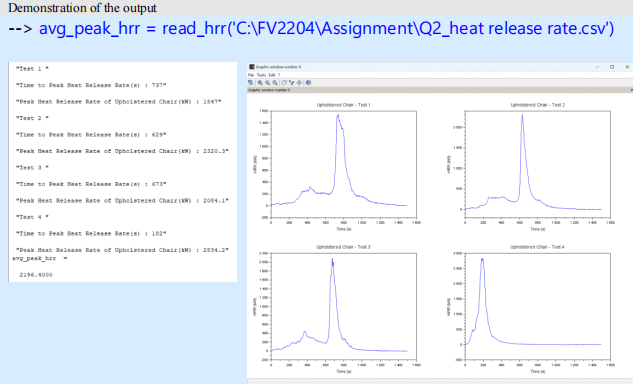
Q3. (Learning Outcome 3) The following equations are used to calculate the thermal response of a detector or sprinkler located at or near a ceiling whose area is large enough to neglect the effects of smoke layer development. When the detector or link temperature reaches its activation temperature, then the detector will be activated.
The rate of temperature rise of the detector response is modelled by
|
Q(̇)t |
Total theoretical fire heat release rate at time t (kW) |
|
r |
Radial distance of the detector/sprinkler from the vertical axis of the fire (m) |
|
RTI |
Response Time Index of detector/sprinkler |
|
Tjet,t+∆t |
Temperature of the jet at the next time step, t + ∆t (oC) |
|
Tjet,t |
Temperature of the jet at the previous time step, t (oC) |
|
T∞ |
Ambient space and initial detector/sprinkler temperature (oC) |
|
TD,t |
Detector or sprinkler temperature at time, t (oC) |
|
TactiVation |
Detector or sprinkler activation temperature, t (oC) |
|
vjet,t |
Velocity of the ceiling jet gases at the time step, t (m/s) |
|
z |
Vertical entrainment distance; the difference between the height of the ceiling and the base of the flames (m) |
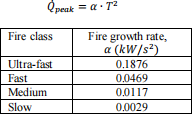
Assume the fire will develop as a t-square growth fire. Four fire classes named as “U” – ultra-fast, “F”- fast, “M” – medium and “S” – slow will be considered. The fire growth rate table is summarized at the right table.
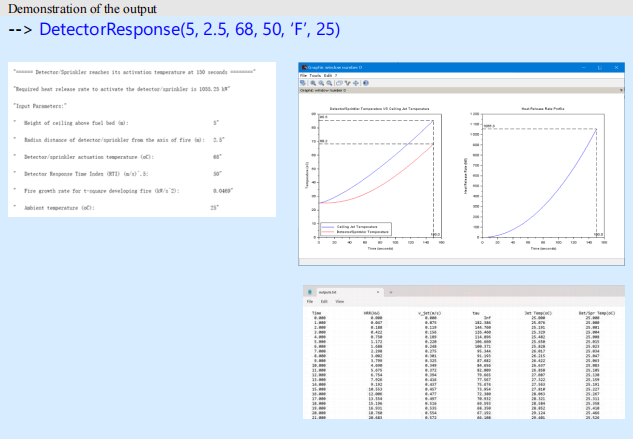
You are required to write a Scilab function with the header
DetectorResponse(spr_vertical_distance, spr_radius_distance,
spr_act_temp, spr_RTI, fire_class, room_amb_temp) to estimate the
activation time of the detector/sprinkler (TD,t ) and required heat release rate to activate the detector/sprinkler. The Scilab function DetectorResponse shall be able to
(1) Plot the t-square growth fire curve till the activation of the detector/sprinkler;
(2) Plot the detector/sprinkler temperature ( TD,t ), ceiling eet temperature ( Tjet,t )
varying with time till the activation of the detector/sprinkler; and
(3) Save the iteration results for all the variables including Q(̇)t, vjet,t , τ , Tjet,t and
TD,t to atext file named as “output.txt” at the end of the simulation.
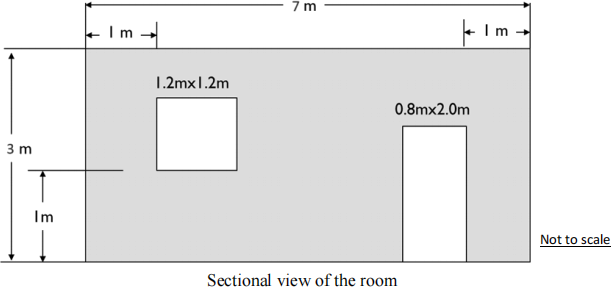
Q4. (Learning Outcome 4) Aroom has 4×7m floor area and 3m height with a door opening of 2.0mhigh and 0.8m wide and a window of 1.2×1.2mopening at 1m above the floor. The sectional view of the room is shown as below. Assume the room is constructed by reinforced concreate of 0.015m thickness with the density of 1,500 kg/m3, specific heat capacity of 0.9 kJ/kg•K and thermal conductivity of 0.5×10⁻³ kW/m•K. You are required to use the two-zone fire model CFAST to study the impact of fire and smoke in the room for 10-mins duration for the below two fire scenarios.
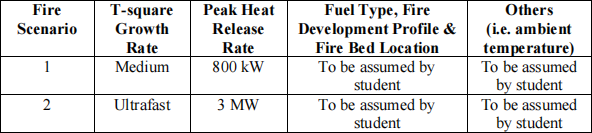
The study shall provide the necessary explanation with at least 150 words on the assumptions such as fuel type, fire development profile (i.e. fire growth rate and fire decay rate), fire bed location, ambient temperature, etc. The student shall explore the generated results by CFAST and summarize the time reaching the untenable criteria for EACH fire scenario referring to the smoke layer height, smoke temperature and gases concentration in the room.
Marking Criteria
Marks will be allocated according to the following criteria:
|
Marking Criteria |
Marks allocation |
|
Knowledge of relevant material and grasp of themes: Students to use own words in demonstrating awareness and appreciation of key issues. |
30 |
|
Analysis, synthesis and depth of argument: Identification of key points and justified put forward clearly and succinctly. |
30 |
|
Engineering principle/calculation: Correct application of concept/formulae with complete accuracy and correct answer. |
30 |
|
Structure: Logical structure with introduction, background and executive summary. |
10 |
|
Total |
100 |
2024-01-29