Lab Assignment 1
Hello, dear friend, you can consult us at any time if you have any questions, add WeChat: daixieit
Lab Assignment 1
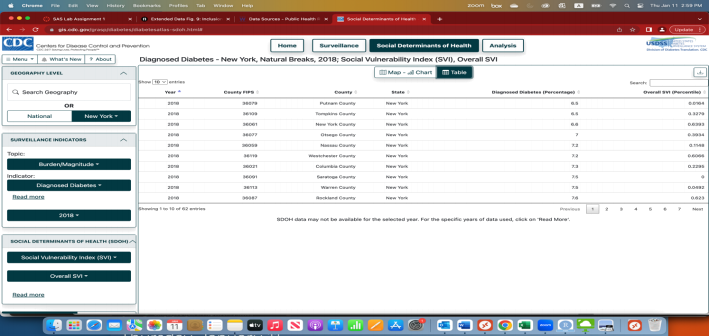
Data source:https://gis.cdc.gov/grasp/diabetes/diabetesatlas-sdoh.html#
For submission, upload 2 files: SAS program (.sas) and log (.log) on Canvas. Please write your sas program in this general format:
|
*Lab assignment 1; * Read in dataset; <your code> *Tasks; *1. Generate a summarized information about the dataset using proc contents.; <your code> *2. What’s the average Diagnosed Diabetes Percentage and average Overall SVI in the entire New York state? <your code> … |
1. Go to the link above, select year 2018 and state New York. Download .csv by clicking the download sign on the top right.
2. Upload the dataset to SAS studio and read it into a permanent library you created (look at
the excel file first, make sure you are reading in the correct column names).
3. Use SAS programming to find out the following:
1. Generate a summarized information about the dataset using proc contents.
2. What’s the average Diagnosed Diabetes Percentage and average Overall SVI in the entire New York state?
3. How many counties have Diagnosed Diabetes Percentage>8?
4. How many counties have Overall SVI >0.8?
5. Show a descriptive summary of the two variables Overall SVI and Diagnosed Diabetes Percentage (must show quantiles).
6. Out of those counties with Diagnosed Diabetes Percentage>8, what’s the mean,
standard deviation, minimum and maximum of their overall SVI?
7. Create an indicator variable called “High_risk” defined by:
- Overall, SVI> 0.7 and Diabetes Percentage>7.5
8. Show a frequency table of the variable High_risk you created in previous step.
2024-01-22