FIT2086 Studio 12 Sample Exam Questions
Hello, dear friend, you can consult us at any time if you have any questions, add WeChat: daixieit
FIT2086 Studio 12
Sample Exam Questions
October 13, 2023
Contents
1 Introduction
The Studio 12 questions are examples of the type of questions you will be asked on the exam, in number and length roughly commensurate with the real exam. Please work on this questions during, and after the studio. You may ask your demonstrator for some assistance on the questions your studio time.
2 Short Answer Questions
Please provide a short (2-3 sentences) description of the following terms:
1. Bias and variance of an estimator
2. A p-value
3. Classification accuracy, sensitivity, specificity
4. A decision tree
5. Penalized regression
6. A random variable
3 Maximum Likelihood Estimation
A random variable Y is said to follow an exponential distribution with a rate parameter β, if
r(Y = y | β) = β exp (−βy)
where y > 0 is a non-negative continuous number. Imagine we observe a sample of n non-negative real numbers y = (y1 , . . . , yn ) and want to model them using an exponential distribution. (hint: remember that the data is independently and identically distributed) .
1. Write down the exponential distribution likelihood function for the data y (i.e., the joint probability of the data under an exponential distribution with rate parameter β).
2. Write down the negative log-likelihood function of the data y under an exponential distribution with rate parameter β .
3. Derive the maximum likelihood estimator for β .
4 Random Variables
Suppose Y1 and Y2 are two random variables distributed as per Y1 ∼ Poi(2) and Y2 ∼ Poi(4). Remember that Poi(λ) denotes a Poisson distribution with rate parameter λ, which means the random variable follows the probability distribution:
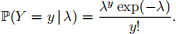
Recall that if Y ∼ Poi(λ), then E [Y] = λ and V [Y] = λ . Let S = Y1 + Y2 denote the sum of these two variables; then:
1. What is the value of E [S]?
2. What is the value of V [S]?
3. What is the probability that S = 0?
4. What is the value of E [Y1 Y2]?
5. What is the value of E lY12]?
5 Confidence Intervals and p-values
Consider a drug targetting obesity being considered for introduction to the market by the Therapeutic Goods Administration (TGA). The drug has been demonstrated to substantially reduce BMI, but the TGA are concerned about possible side-effects. They have measured cholestrol levels (in millimols per L mmol/L) on a cohort of 7
individuals who have been administered our drug. The measurements were
y = (5, 5.2, 5.05, 5.35, 5.03, 5.43, 5.36).
The population standard deviation for cholesterol levels is 0.6mmol/L. We can assume that a normal distribution is appropriate for our data, and that the population standard deviation of cholesterol levels for individuals in our sample is the same as the population standard deviation of cholesterol levels for the general population.
1. Using our sample, estimate the population mean cholesterol levels of people being administered the drug. Calculate a 95% confidence interval for the population mean cholesterol level. Summarise your results.
2. The mean cholesterol level in the general populace is known to be 4.8mmol/L. The TGA wants to know two things: (i) is the population mean cholesterol level in people being given the drug different from the general population, and (ii) is it lower than in the general population. Specify appropriate null and alternative hypotheses for these two questions, and calculate appropriate p-values to provide evidence against each null hypothesis. What is your conclusion regarding these two questions?
6 Regression
1. Please explain the intuition behind the principle of least squares that is used to fit a linear model with predictor
x = (x1 , . . . , xn ) to the targets y = (y1 , . . . , yn ), and write down the least-squares objective function.
2. If one of our predictors in a regression, or logistic regression model, is categorical, how can we handle it?
3. Imagine we model a persons blood pressure in mmHg (BP) using a linear regression. Two predictors are fitted as part of the model: (i) the persons age in years (AGE), and the amount of alcohol they consume on average per week ALCOHOL (in standard drinks). The model we arrived at is:
E [BP] = 51 + 1.4 AGE + 0.6 ALCOHOL
(a) From this model, how does a person’s blood pressure change as their age and alchohol consumption vary?
(b) If a person is 33 years old, and drinks on average 2.5 standard drinks per week, what is their expected blood pressure?
4. The R2 statistic is defined as:

where RSS is the residual sum-of-squares and TSS is the total sum-of-squares.
(a) What does an R2 of 1 mean?
(b) What is an advantage of using the R2 statistic over simply using the residual sum-of-squares (RSS) to measure goodness-of-fit?
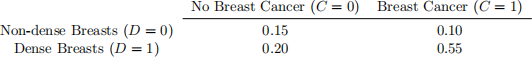
Table 1: Population joint probabilities of having dense breasts (D), and breast cancer by age 60 (C).
7 Classification
Breast cancer is one of the leading causes of death of women in Western populations. It is believed that mammo- graphic density, which is defined as the amount of non-fat tissue in a woman’s breast, is strongly associated with the risk of developing breast cancer. We define a woman’s breasts to be “dense” if they contain over 70cm3 of non-fat tissue. Table 1 shows the joint probabilities of having dense breasts and contracting breast cancer by age 60.
1. What is the probability of contracting breast cancer by age 60 given that a woman does not have dense breasts?
2. What is the probability of contracting breast cancer by age 60 given that a woman does have dense breasts?
3. What is the odds of contracting breast cancer given we have dense breasts?
4. Do you think that having dense breasts is a good predictor of contracting breast cancer by age 60, and why/why not?
8 Logistic Regression
Imagine that we have built a logistic regression model to predict the probability of heart disease, H, given a persons age (AGE, in years) and their cholesterol level (CHOL, in mg/dl):
logOdds(H) = −7 + 0.0082 CHOL + 0.1 AGE
1. From this model, what is the effect of age of heart disease?
2. If a person is 70 years old and has 260 mg/dl cholesterol, what is the probability that they will have heart disease?
3. Using this probability, if you were asked to predict if they have heart disease, what would you say?
4. If you suspected cholesterol was non-linearly related to the log-odds of having heart disease, what could you do to try and improve the model?
9 Bias and Variance
Imagine you have a n random variables Y1 , . . . , Yn , with mean E [Yi] = µ and variance V [Yi] = σ 2 . Consider the sample mean

Answer the following questions:
1. Prove that the sample mean  is an unbiased estimator of the population mean.
2. Prove that the sample mean  has variance V [
 ] = σ 2 /n.
3. Prove that the sample mean is a consistent estimator of the population mean.
10 Machine Learning
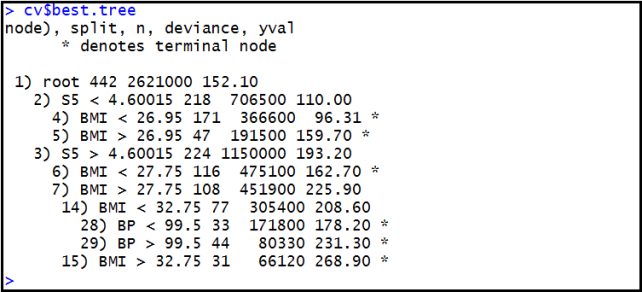
Figure 1: R output describing a decision tree learned using cross-validation for the diabetes progression dataset.
1. We have collected data on n = 442 diabetic people. Figure ?? shows the R output after using the tree package to learn a decision tree to predict their degree of diabetes progression (a non-negative integer) using three predictors in the dataset. The predictors used were as follows: BMI is body-mass index (kg/m2 ), BP is blood pressure in millimeters of Mercury and S5 is serum measurement (in millimeters).
(a) How many “leaf” nodes does the tree have?
(b) If BMI = 23, BP = 29.1, S5 = 5.5 what is the degree of diabetes progression predicted by this tree? (c) What combination of predictors leads to the greatest degree of diabetes progression?
2. Discuss one advantage that a decision tree has in comparison to a linear regression model.
3. The k-nearest neighbours method is a commonly used machine learning algorithm.
(a) Figure ?? shows a scatter plot of a training sample of women, both with and without breast cancer. The x and y axis are the predictors volume of dense tissue in the woman’s breast and body mass index, respectively. The question mark shows a new individual we have obtained data on, but for whom we do not know disease status. Would a k-nearest neighbour algorithm, using standard Euclidean distance and k = 4 nearest neighbours, predict them to have breast cancer or not? Please justify your answer.
(b) Looking at the configuration of the data points in Figure ??, do you think that a logistic regression model would be appropriate for seperating women with and without breast cancer on the basis of the volume of dense tissue in a woman’s breast and her body mass index? If so, why do you think so, and if not, why do you think it is not appropriate?
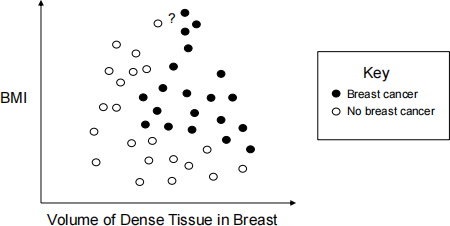
Figure 2: Scatter-plot of body mass index (BMI) against percent dense-tissue in a woman’s breast for women with and without breast cancer.
2024-01-09