FIN 320 Fall2023 PROBLEM SET #4
Hello, dear friend, you can consult us at any time if you have any questions, add WeChat: daixieit
FIN 320
Fall2023
PROBLEM SET #4
Important 1: When you submit your solutions on Blackboard include the number of your group on the file name as follows:
“Problem_Set_4_GROUP_4.xlsx”
Important 2: Submit Excel files
Important 3: Please solve each problem on a separate Excel tab
Question 1
Assume the risk-free rate is 4% per year, the expected return on the Market Portfolio is 8% per year and the standard deviation of the return on the Market Portfolio is 20% per year. A share of ABC stock is now selling for $50. ABC stock will pay a dividend of $2.50 per share at the end of the year. The beta of ABC stock is 1.20.
a) Under the assumptions of the CAPM, what do investors expect the stock to sell for at the end of the year?
b) While investors in general expect the stock to sell for what you found above, you disagree from the consensus and expect that ABC stock will sell for $53.40 at the end of the year. From your perspective, what is the alpha of ABC stock?
Question 2
Consider a risky asset. The end-of-year cash-flow derived from the asset will be either 0 with probability 0.90 or $50,000,000 with probability 0.10. The risk-free rate is 4% per year.
a) If investors require a risk-premium of 12% per year to hold the asset, how much are investors willing to pay for the asset?
b) Suppose that the asset pay-off (and therefore the return of investing on the asset) is uncorrelated with the Market Portfolio (i.e., ρiM=0 where i represents this asset). Under the assumptions of the CAPM, how much are investors willing to pay for the asset?
Question 3
Fiona Fey, a portfolio manager at Tellers Asset Management, is using the CAPM for making recommendations to her clients. The risk-free asset pays 5% per year, and her research department has developed the information shown in the following exhibit.
|
|
Forecasted Return |
Standard Deviation |
Beta |
|
Stock X |
9.5% |
36% |
0.75 |
|
Stock Y |
11.5% |
40% |
1.5 |
|
Market Portfolio |
10% |
20% |
1 |
a) Calculate the expected return of each stock (X and Y) according to the CAPM.
b) Calculate the alpha of each stock (X and Y) from the perspective of Tellers Asset Management.
c) Suppose you want to hold a portfolio consisting of three risky assets: the Market Portfolio, stock X and stock Y. Furthermore, suppose you want the beta of the portfolio to be 1 and the alpha of the portfolio to be +1% per year. Can you find such portfolio? What must be the weights on the Market Portfolio, stock X and stock Y?
Question 4
The one-year returns on stock ABC and on the Market Portfolio depend on the State of the economy according to the Table below.
|
Scenario |
Probability |
Return on ABC stock |
Return on the Market Portfolio |
|
Recession |
0.20 |
0% |
- 15% |
|
Normal |
0.50 |
0% |
10% |
|
Strong Growth |
0.20 |
10% |
15% |
|
Boom |
0.10 |
40% |
30% |
a) Show the expected return on ABC Stock is 6% per year and the expected return on the Market Portfolio is 8% per year.
b) Show that the standard deviation of the return on ABC Stock is 12% per year and the standard deviation on the Market Portfolio is 12.9% per year.
c) Show that the beta of ABC stock is 0.61.
d) The risk-free rate is 3.8% per year. Is the expected return on ABC Stock consistent with the CAPM? Justify your answer.
Question 5
Consider the following sample of annual holding period returns on Masco (a corporation) and the S&P500 Stock Index (includes dividends and capital gains). Assume that the Market Portfiolio is composed of individual US stocks only, so that the S&P 500 Stock Index is a good proxy of the Market Portfolio.
|
Date |
r S&P500 |
r Masco |
|
1-Nov-07 |
-0.0749 |
-0.0756 |
|
1-Nov-06 |
0.0165 |
0.0374 |
|
1-Nov-05 |
0.0352 |
0.0444 |
|
1-Nov-04 |
0.0386 |
0.0294 |
|
3-Nov-03 |
0.0071 |
-0.0109 |
|
1-Nov-02 |
0.0571 |
-0.0188 |
|
1-Nov-01 |
0.0752 |
0.0626 |
|
1-Nov-00 |
-0.0801 |
0.0331 |
|
1-Nov-99 |
0.0191 |
-0.1684 |
|
2-Nov-98 |
0.0591 |
0.0242 |
|
3-Nov-97 |
0.0446 |
0.0724 |
|
1-Nov-96 |
0.0734 |
0.1641 |
|
1-Nov-95 |
0.0410 |
0.0488 |
|
1-Nov-94 |
-0.0395 |
-0.0640 |
|
1-Nov-93 |
-0.0129 |
0.0748 |
|
2-Nov-92 |
0.0303 |
0.0693 |
|
1-Nov-91 |
-0.0439 |
-0.1203 |
|
1-Nov-90 |
0.0599 |
0.0675 |
|
1-Nov-89 |
0.0165 |
0.0146 |
|
1-Nov-88 |
-0.0189 |
-0.0806 |
|
2-Nov-87 |
-0.0853 |
-0.1607 |
.
a) Use Excel to calculate Masco’s beta given the data above.
b) Use the data sample and your answer to b) to estimate the expected return on Masco stock according to the CAPM and according to the historical method. Assume that the risk-free rate is 4.5% per year.
c) What is the alpha of Masco? Is the stock underpriced or overpriced according to the CAPM?
Question 6
All risky assets available can be classified into one of two broad portfolios: Equity or Debt. Given current market prices and shares/units outstanding, the total market capitalization of Equity risky assets is $60 trillion and the total market capitalization of Debt risky assets is $40 trillions.
Consider the following scenarios for the one-year holding period return on Equity and Debt. The risk-free rate is 4% per year.
|
Scenario |
Probability |
Return on Equity Risky Assets |
Return on Debt Risky Assets |
|
Recession |
0.20 |
- 15% |
0% |
|
Normal |
0.60 |
8% |
5% |
|
Boom |
0.20 |
30% |
6% |
a) Calculate the expected returns on Equity and Debt.
b) Calculate the standard deviations of returns on Equity and Debt.
c) Calculate the correlation of returns between Equity and Debt.
d) What are the weights of Equity and Debt on the Market Portfolio?
e) What is the beta of Equity? What is the beta of Debt?
f) Are expected returns on Equity and Debt Risky assets consistent with the CAPM? Why?
Hints:
i) The covariance of an asset with a portfolio is the weighted average of the individual covariances. That is, for any portfolio weights wi and wj, Cov (wi ri + wj rj , rk ) = wi Cov (ri. rk ) + wj Cov (rj . rk )
ii) The covariance of an asset with itself is the asset’s variance
iii) The Market Portfolio is the sum of Equity and Debt
iv) To create Market Portfolio returns for EACH scenario simply calculate the weighted average of Debt and Equity returns for each scenario
v) The beta of the Market Portfolio is equal to one. ALSO, the beta of the Market Portfolio is equal to the weighted average of the Equity beta and the Debt beta
Question 7
For 2016, Toyord Corporation’s dividends are expected to be $3 per share. After that, dividends will grow at a 5% rate. Between now and 2016, the firm will not distribute any dividends. The risk premium on the Market Portfolio is 5%, the beta of Toyord stock is 1.1 and the risk-free rate is 4.5% per year.
What is the fair price of one share of Toyord stock today according to the CAPM ?
Question 8
The Market Portfolio consists of US bonds and US stocks only. The total market capitalization of US stocks is $15 trillion, while the total market capitalization of US bonds is $20 trillion. Assume that Money Market investments, with total market capitalization of $5 trillion, represent the risk-free asset. The standard deviation of US stock returns is 25% per year, while the standard deviation of US bond returns is 7% per year. The correlation between them is -0.2. The Market Risk Premium is 1.99%.
a) What is the composition (i.e., weights) of the Market Portfolio?
b) What is the standard deviation of the Market Portfolio?
c) What is the beta of US stocks? What is the beta of US bonds?
d) What is the risk premium in US stocks? What is the risk premium in US bonds?
Hints:
i)The covariance of an asset with a portfolio is the weighted average of the individual covariances. That is, for any portfolio weights wi and wj, Cov (wi ri + wj rj , rk ) = wi Cov (ri. rk ) + wj Cov (rj . rk )
ii) The covariance of an asset with itself is the asset’s variance.
Question 9
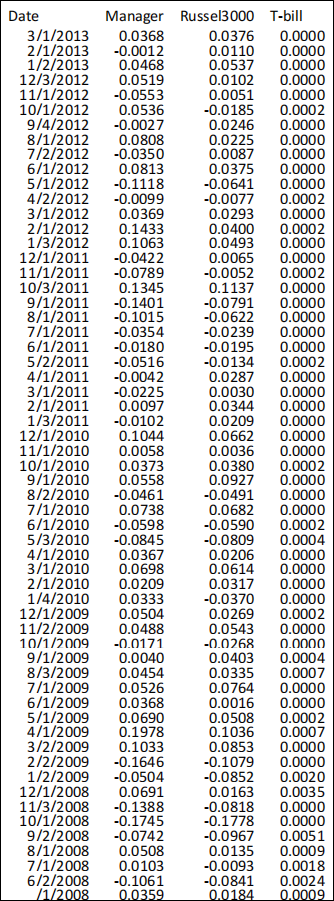
Consider the following sample of monthly holding period returns (after fees) on an actively managed mutual fund invested in US stocks, the Russell 3000 stock index, and one-month T- bills. Assume that the Market Portfolio is composed of individual US stocks only, so that the Russell 3000 is a good proxy of the Market Portfolio. Is the manager of the fund doing a good job for its investors? Discuss.
Question 10
From Yahoo! Finance download monthly price data for Goldman Sachs and Tesla for the past five years. Also, download data for S&P500.
a) Calculate the alpha and beta of the two stocks in Excel using 1) Regressions 2) The formulas for alpha and beta.
b) What do the beta and alpha of the two stocks tell us about their exposure to systematic risk and over-performance with respect to the Market?
c) Assuming that for the next month the risk-free rate is 0.3%, the expected return on the market is 1%, what is the expected return of the two stocks according to the CAPM?
For your risk-free rate, you can use the data from the project.
2023-12-15