Introduction to Multi-armed Bandit Algorithms
Hello, dear friend, you can consult us at any time if you have any questions, add WeChat: daixieit
GEC Academy
Introduction to Multi-armed Bandit Algorithms
Homework Assignment
Instructions
. There are five problems in this Assignment that are related to each other.
. Attach your code to receive full credit. We recommend using Python but the choice is yours.
. It is recommended that you use a Document Scanning application, e.g., iOS Notes, CamScanner, to convert your solutions to PDF format.
Comparing the Performance of Multi-armed Bandit Algorithms
In this exercise, we will compare the performance of three multi-armed bandit (MAB) algo- rithms on real datasets. The datasets we will use to that end are as follows:
. Movie Lens Dataset: https://grouplens.org/datasets/movielens/1m/
. Goodreads Dataset: https://sites.google.com/eng.ucsd.edu/ucsdbookgraph/ home
. Open Bandits Dataset: https://arxiv.org/pdf/2008.07146.pdf
Choose one of these datasets. Movie Lens and Goodreads datasets contain user ratings for movies and books, respectively. Your main goal is to compare the performance of the fol- lowing MAB algorithms: Explore-then-commit (ETC), Upper Confidence Bound (UCB), and Thompson Sampling (TS). The comparison will be in terms of the expected cumulative Regret an algorithm incurs until round t, where t = 1; : : : ; n. Here, ndefines the horizon, i.e., the total number of rounds the algorithm is used. Depending on the data set, decide on what “arms” may represent and what “rewards” may represent. For example, each movie genre can be an arm, and user ratings can be considered as the reward received when movie from a genre is rated by a user. Please stick with the same set-up and data-set for all questions below.
Problem 1
This question aims to demonstrate the fact that theoretical results presented in the lectures are for the mean regret. Thus, to check their validity in real-world experiments, we need to run a sufficient number of experiments and look at the average value of the cumulative regret.
Choose the horizon as n = 50; 000. For each algorithm run ten experiments and record the cumulative regret at each round t = 1; : : : ; n in all experiments. For the ETC algorithm, set the length m * k of the exploration phase as  10% of n, i.e., m * k 5, 000. (In Problem 3, we will explore the impact of m on the performance).
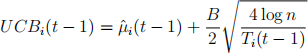
For the UCB algorithm, you should set the UCB index for arm i at round t — 1 as
 (1)
(1)
where B is the difference between the maximum possible reward value and the minimum possible reward value. For example, for the Movie Lens dataset where rewards (i.e., ratings) can be in the interval 1-5 (stars), B should be set as 4. Note that, in the lecture notes, we took B = 1 since we assumed that rewards are 1-sub-Gaussian. In general, a bounded random variable with difference between maximum and minimum value being B is σ-subgaussian where σ = ![]() B2, and the exploration bonus needs to be updated as in (1). With this information, (1) matches what was presented in the Lectures by taking δ =
B2, and the exploration bonus needs to be updated as in (1). With this information, (1) matches what was presented in the Lectures by taking δ = ![]() .
.
For the TS algorithm, you should initialize by choosing each arm once. In other words, for the first k rounds, you just choose arm 1, arm 2, . . . , arm k, respectively. Then, we suggest updating the distributions Fi (t), i = 1, . . . , k for the belief on the mean rewards of arms as follows:
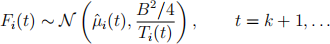
where ˆ(μ)i (t) is the average reward of arm i until round t, B is as given above for the UCB algorithm, Ti (t) is the number of samples received from arm i until round t, and Ⅵ (μ, σ2 ) stands for the Gaussian distribution with mean μ and variance σ2 .
Plot the result often experiments separately on the same figure for each algorithm. Namely, you will produce three figures, one for each algorithm. Each figure should have ten curves, one for each experiment, representing the cumulative regret in round t as t varies from 1 to 50, 000. Comment on what you see from these figures. For example, do you get the same regret value in each experiment? If not, which algorithm seems to have more variation across experiments?
Now, run 100 experiments for each algorithm and plot the average regret together with error bars indicating one standard deviation above and below the mean. See Figure 1 below for an example plot.
For all remaining parts, plots should be obtained by averaging over 100 experiments and errors bar should be shown as indicated above (unless otherwise indicated).
Problem 2
This question is about setting the value of horizon n appropriately. Some of the theoretical results presented in lectures, e.g., the fact that cumulative regret scales as the logarithm of n for the algorithms presented, are valid in the limit of n ! 1. In practice, how large n should be to see this logarithmic behavior may depend on the particular setting used including the algorithm and the reward distributions.
We will consider five different values for the horizon: n = 500, n = 5; 000, n = 50; 000, n = 500; 000, and n = 5; 000; 000. For the ETC algorithm, set the length m * k of the exploration phase as 10% of n. For each n value, plot the average regret of the three algorithms on the same plot,i.e., you will produce five figures, one for each n value, with each figure containing three curves, one for each algorithm. For this question, error bars are not needed.
Comment on the results. At what value of n, do you start seeing the logarithmic regret behav- ior? Is this value different for different algorithms? Do you see the performance comparison across three algorithms changing with the value of n?
Problem 3
In this question, we will explore how to set the parameter m for the ETC algorithm, i.e., to see how long should we explore.
Set n = 50; 000. For your chosen dataset, plot the performance of the ETC algorithm for five different m values: m * k = 50, m * k = 500, m * k = 2; 000, m * k = 5; 000, m * k = 10; 000. As before, average over 100 experiments and show the error bars. Comment on the results you are seeing. Also, compare the results for the best performing m value with the performance of the UCB and TS algorithms as in Problem 1.
Problem 4
In this question, we will compare the performance of the UCB and the asymptotically optimal UCB algorithms. Put differently, we will explore the impact of the exploration bonus on the algorithm performance.
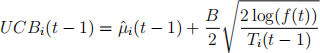
Choose n = 50; 000. The asymptotically optimal UCB algorithm uses the UCB index given
as
 (2)
(2)
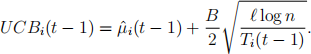
where f (t) = 1 + t(log t)2. Here, B is defined as in Problem 1. The standard UCB algorithm uses the index as given in (1). We can more generally state this as
 (3)
(3)
In this problem, we will compare the performance of the asymptotically optimal UCB and the standard UCB with three different ` values: ` = 1, ` = 2, and ` = 4. Note that, the larger is the ` value the more will the algorithm explore, while with smaller ` it will more aggressively exploit.
Plot the cumulative regret performance of the four algorithms as indicated above, asymp- totically optimal UCB, and standard UCB with three different ` values, by averaging over 100 experiments and also showing the error bars.
Problem 5
In this question, we will compare all 4 algorithms in the same plot.
Set n = 1, 000, 000. Plot on the same figure the results for ETC, UCB, asymptotically optimal UCB, and Thompson Sampling algorithms (averaged over 100 experiments with error bars) and compare their performance.
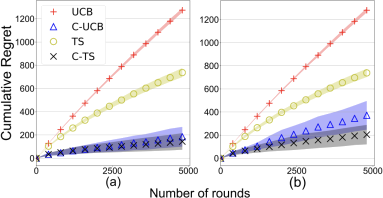
Figure 1: Example plots showing cumulative regret as a function of the number of rounds for different algorithms.
2023-11-10