MGMT90280 Managerial Decision Analytics Semester 1 2023
Hello, dear friend, you can consult us at any time if you have any questions, add WeChat: daixieit
Semester 1 2023
Management and Marketing
MGMT90280
Managerial Decision Analytics
SECTION 1
This section contains 5 questions. You are required to answer 5 questions. This section accounts for 100 marks.
Question 1 (20 marks)
PART 1
THE ICONIC is a Sydney-based, Australian online fashion and sports retailer. During the COVID-19 pandemic, Dave Sharam, the director of marketing, decided to expand the company’s internet
presence further, hoping that this would result in increased sales. Dave therefore conducted an investigation on the success of Internet ads of THE ICONIC placed on major fashion weblogs.
Results of this investigation showed that on average customers who purchased from THE ICONIC website and saw the ads on weblogs spent more on the company’s products than the customers who did not see the ads. Considering this, Dave continued to investigate how placing online ads on fashion weblogs could draw more customers to purchase THE ICONIC’s products.
One idea revolved around strategically releasing ads for the company on fashion weblogs prior to and during the holiday season. To uncover which weblog could be most effective for ads, Dave
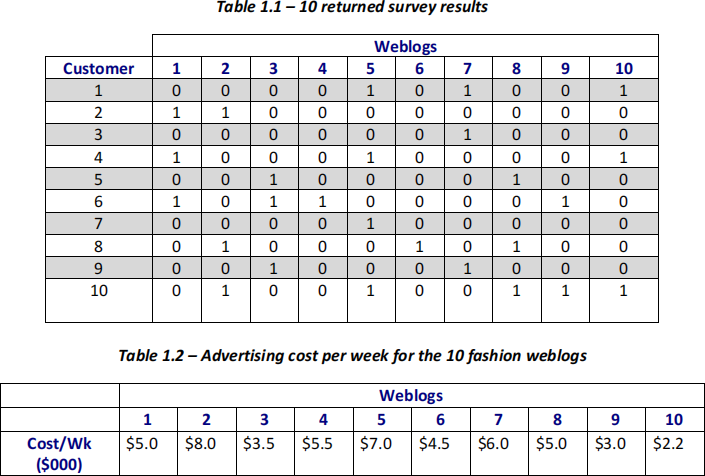
and his team have planned to conduct a follow-up study using surveys sent through e-mail to collect data of their current customers asking them which of the top fashion weblogs they
regularly visit. So far, Dave and his team have collected 10 surveys that were returned by their
customers, and they decided to proceed with model development using this data for the top 10 weblogs in the questionnaire (please see Table 1.1 below). For a given customer-weblog pair, “1” indicates that the customer has visited weblog and see the add, and “0” indicates otherwise.
One issue here though is that the data in Table 1.1 shows multiple exposures of a single customer to the company’s ads. For example, if customer 1 visits weblogs 5, 7 and 10 that contain THE
ICONIC’s ads, while being good for the company, it increases the costs of advertising as only one time exposure of the customer to the ad would have been sufficient.
The costs of ads per week for the 10 fashion weblogs are given in the following Table 1.2. The overall advertising budget is $8,000 per week.
As a managerial decision analyst on Dave’s team, please develop a(n) (I)LP model to maximize the number of customers reached for one week of promotion prior to next holiday season while
reducing multiple exposures of each individual customer to the ads. (8 marks)
PART 2
Peter Jackson is an Australian garment maker constructing quality men’s suits with a passion for innovative design and a strong emphasis on revolutionising the menswear retail space. Peter
Jackson has collected data on pricing and sales over the last three years at its flagship store in
Chadstone Shopping Centre. These data were used to estimate a regression equation that relates price to demand. The following estimated equation relates demand to the price for pure wool suits:
Y = 3,500 – 2.79 p
Where Y is the demand for pure wool suits and p is the price per suits. The cost of each pure wool suit for this company is $760. The data also show that when a pure wool suit is sold, on average
one pair of shoes and one business shirt are sold with the suit. The profit on a pair of shoes is
$190 and the profit on a business shirt is $95. Your manager gave you the task to create a model to maximize the profit according to the below scenarios:
(i) Ignoring the profit associated with the accompanying pair of shoes and business shirt? (2 marks)
(ii) Including the profit associated with the accompanying pair of shoes and business shirt purchases? (2 marks)
PART 3
Paul Smith, a farmer in north Queensland, is determining what crops to grow on his 120-acre of land that he purchased recently. There are two crops he is considering: wheat and chickpea.
Wheat is more expensive than chickpea in the market. Specifically, the price for wheat is $9 per bushel and the price for chickpea is $2 per bushel. Based on historical data, the average yield for wheat is 60 bushels per acre and that for chickpea is 220 bushels per acre. Two key resources used to grow a crop are labour and machine (e.g., harvesters). For simplicity, we consider the following resource requirements: An acre of wheat requires 2 units of labour while an acre of chickpea requires 3 units of labour. For the machine requirement, an acre of wheat requires 40 hours of machine time while an acre of chickpea requires 30 hours of machine time. Paul Smith has secured 350 units of labour and 3,800 hours of machine time.
Paul’s aim is to maximise his total revenue by choosing the optimal area of land on which to grow each of chickpea and wheat. To this end, Paul has recruited a management consultant to help him with this optimisation problem. Table 1.3 below shows how the consultant has solved the problem:
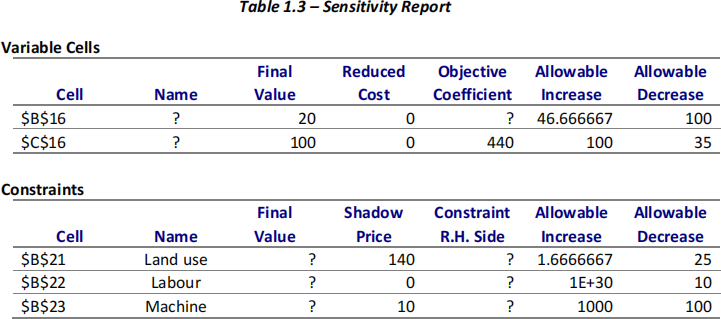
(i) For the optimal solution, how much land is used to grow each of the two crops, and what is the maximum revenue? (3 marks)
(ii) How much would the total revenue increase if the machine time available was increased from 3,800 to 4,000 hours? (2 marks)
(iii) Paul Smith has an opportunity to sell 10 acres of land at a price of $2,000. Do you recommend him making the sale? (3 marks)
Question 2 (20 marks)
Jabra is a Danish brand specialising in audio equipment, and more recently videoconference
systems including the Jabra headsets that are being sold in Australia. The cost of manufacturing
the headsets by Jabra is $75 and each headset is being sold with the market price of $125 in
Australia. Monthly demand for Jabra in Australia is a normal variable with a mean of 10,000 and
standard deviation of 200 headsets. At the beginning of each month, Jabra replenishes 10,000
headsets to its warehouses in Australia. If the monthly demand is less than 10,000, then Jabra
pays $15 per headset inventory holding cost. On the contrary if demand is more than 10,000 Jabra pays $30 per headset shortage cost. Jabra’s lead analyst has modelled this problem using Monte Carlo simulation. Below (Figure 2.1) is a screenshot of the simulation results. Please answer the following questions.
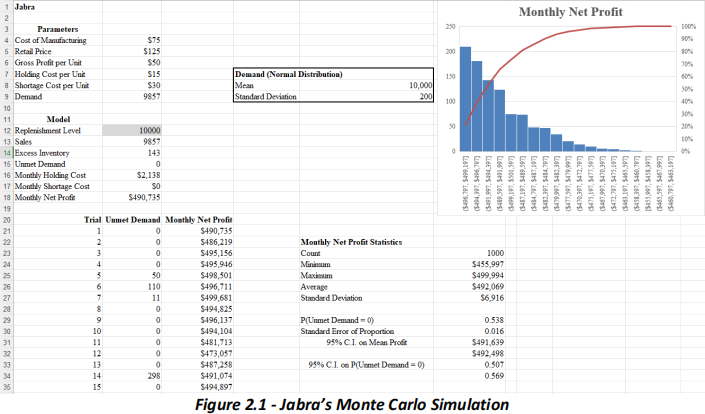
(i) What are the input and output variables in this model? Please specify which input is controllable and which input is uncontrollable. (4 marks)
(ii) What is the deterministic formula for Jabra’s monthly net profit when demand is smaller than monthly replenishment quantity of 10,000? (4 marks)
(iii) Please explain how this problem is simulated by Jabra’s lead analyst step by step. (9 marks)
(iv) After solving the simulation, Jabra’s lead analyst understand monthly net profit in Australia follows a uniform distribution of U($450,000, $ 500,000). What are the odds that Jabra’s profit next month will be exactly $500,000? (3 marks)
Question 3 (20 marks)
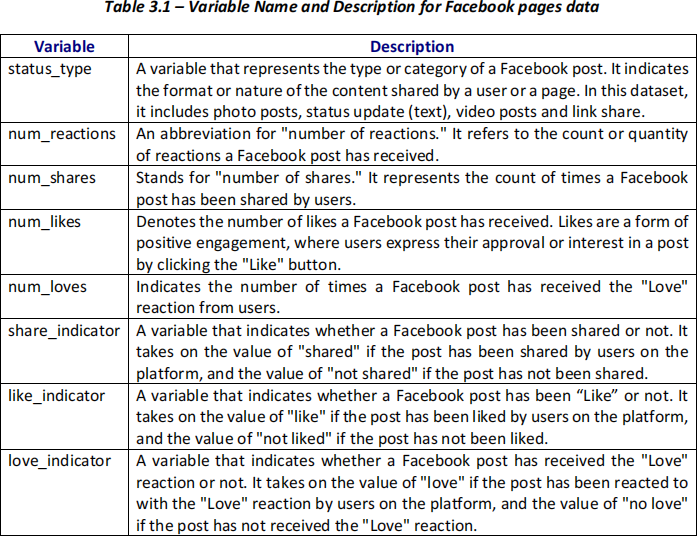
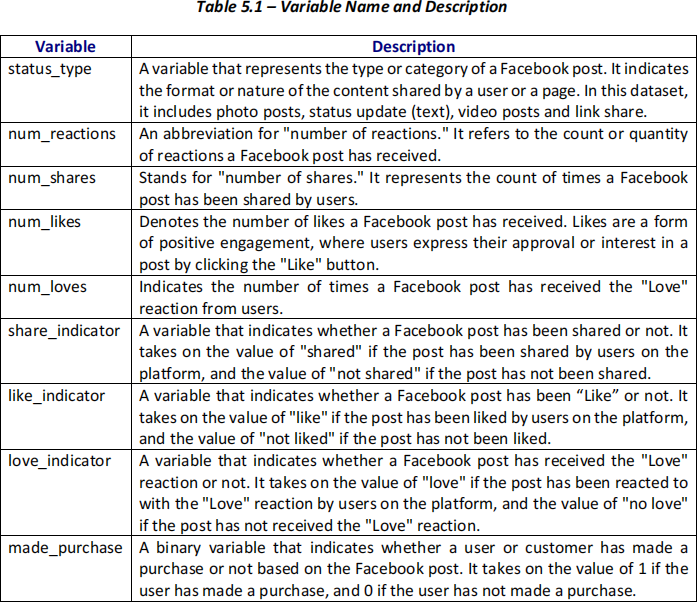
Located in Melbourne, Dataraft, is a customer strategy and analytics firm that has been tasked with conducting an in-depth analysis of the Facebook pages of ten Australian fashion retail sellers for a client. Your business analytics manager has specifically assigned you the responsibility for this project. The analysis focuses on posts of various types, including videos, photos, statuses, and links, to understand the nature of content shared by these sellers. Furthermore, engagement metrics such as comments, shares, and reactions are assessed to gauge the level of interaction and response from the audience. By exploring these factors, it aims to gain insights into the social media strategies employed by these Australian fashion retail sellers and their effectiveness in capturing the attention and engagement of Australian Facebook users. Below (Table 3.1) are the variables utilised in this analysis.
A subset of this data (Table 3.2) has been extracted to be used for some of the calculations in the following questions.
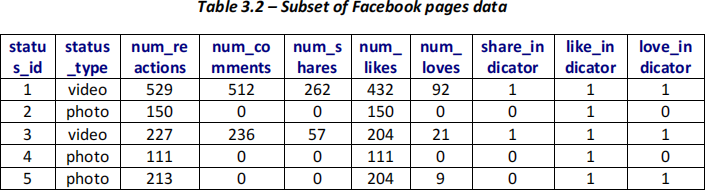
(i) Using only the categorical variables from the dataset provided above (Table 3.2), measure the similarity between “Status IDs 1 & 2” and “Status IDs 2 & 5” using the Matching Coefficient and Jaccard’s Coefficient. Please leave your answers as fractions and show your workings. (5 marks)
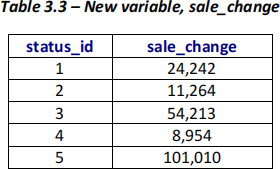
(ii) Your business analyst manager is also interested in measuring the similarity between “Status IDs 1 & 2” and “Status IDs 2 & 5” using the Euclidean distance. For these calculations, use only the numerical variables from the dataset provided above (Table 3.2), as well as the recently obtained variable (Table 3.3 below), sale_change, which measures the change in sales (in Australian dollars) following the Facebook post after a week. Which pair of status IDs is more similar and why? Round your answers to two decimal points and show your workings. (6 marks)
(iii) A hierarchical clustering (with Ward’s method) was used for this problem and produced a dendrogram. Also, a summary of results using Excel’s Pivot table was generated. Use the following output/s to address the following sub-part questions.
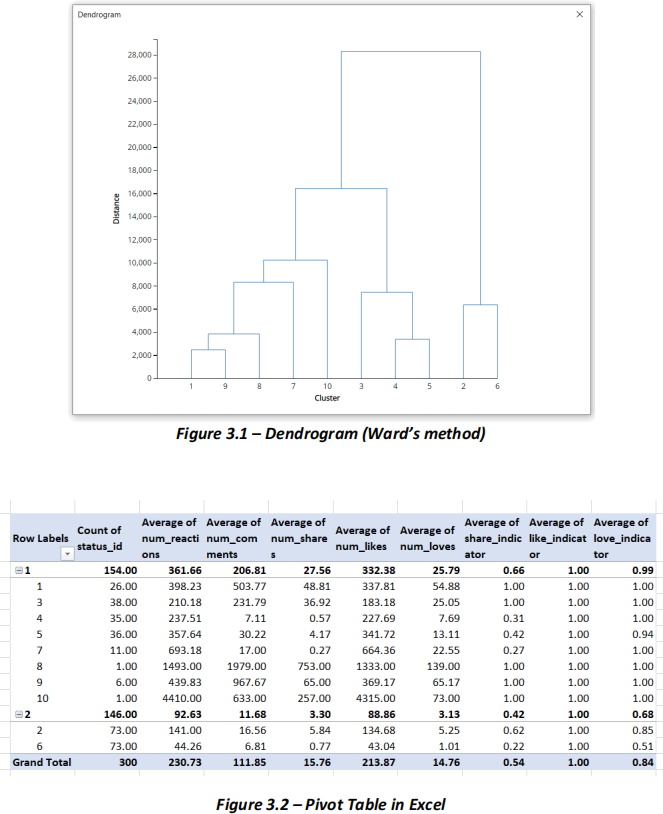
a. Using the outputs provided above, how many clusters are there at the dissimilarity (distance) of 25,000? What can you say about the size of the clusters? (2 marks)
b. Using the outputs provided above, how many clusters are there at the dissimilarity (distance) of 14,000 and list out the sub-clusters for each cluster you have identified. What can you conclude about the cluster with only two sub-clusters? (3 marks)
c. Which sub-clusters contain Facebook posts that have not received any "love" reactions? Explain your answer. (2 marks)
(iv) Your business analyst manager has requested additional insights into the data and wants to answer why certain Australian fashion retail sellers are performing exceptionally well. Which sub- cluster/s would you choose to explore in more depth and why? Once you have chosen your sub- cluster/s, what would be your next steps? (2 marks)
Question 4 (20 marks)
Jenny Johnson manages a petrol station on the corner of Lygon and Elgin streets in Carlton,
Victoria. Her station is a franchise, and the parent company calls her station every day at midnight to give her the prices for various grades of petrol for the upcoming day. Over the past eight weeks Jenny has recorded the price and sales (in litres) of regular-grade petrol at her station as well as
the price of regular-grade petrol charged by her competitor within the same neighbourhood. She is curious about the sensitivity of her sales to the price of regular petrol she charges, and the price of regular petrol charged by her competitor.
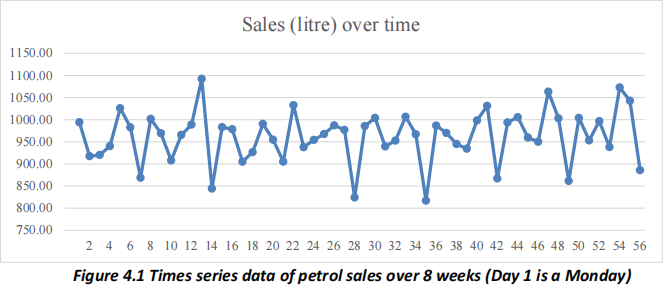
(i) A time series plot of daily sales for Jenny’s station has been constructed and shown in Figure
4.1. What types of relationships exist in the data? Explain. (2 marks)
(ii) Jenny wonders whether her sales differ systematically by day of the week and whether her
station has experienced a trend in sales over the past eight weeks. Use provided summary in
Figure 4.2 to create an estimated multiple regression equation to account for both trend and
seasonal effects in the data. Based on this model, compute an estimate of sales for Tuesday of the first week after Jenny collected her data. Day 1 of data analysis shown in Figure 4.1 is a Monday. (3 marks)
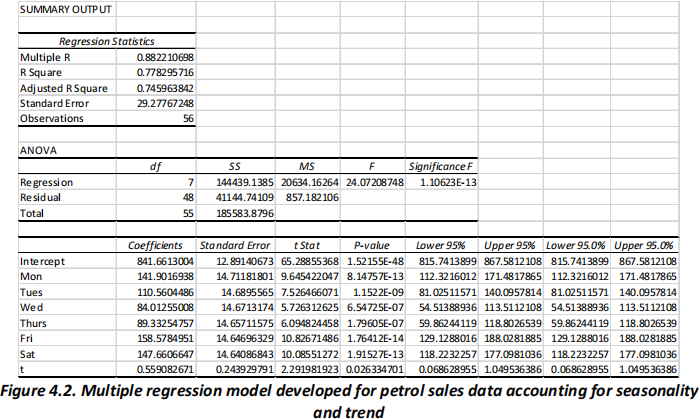
(iii) What is the correct interpretation of the estimated regression parameter associated with “Fri” in Figure 4.2? Is this interpretation reasonable? (2 marks)
(iv) Use provided summary output for multiple regression model with the price Jenny charges for a litre of regular petrol and the price Jenny’s competitor charges for a litre of regular petrol as
causal variables and the trend and dummy variables from part (ii) to create an estimated equation to account for the relationships between these prices and daily sales as well as the trend and
seasonal effects in the data (See Figure 4.3 below).
Based on this model, compute an estimate of sales for Tuesday of the first week after Jenny collected her data for a day that Jenny is charging $3.50 for a litre of regular petrol and her competitor is charging $3.45 for a litre of regular petrol. (3 marks)
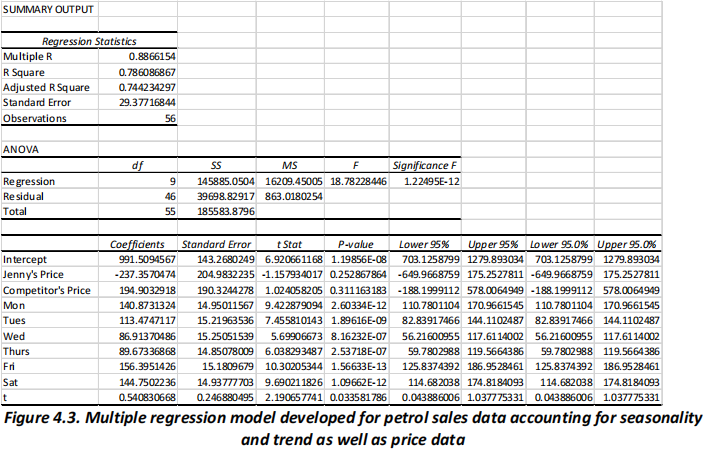
(v) Test whether each of the regression parameters is equal to zero at a 0.05 level of significance for the model shown in Figure 4.3. (5 marks)
(vi) Compare the models in parts (ii) (Figure 4.2) and (iv) (Figure 4.3) in terms of predictability,
overall fit and significance. Explain which model is more effective. (5 marks)
Question 5 (20 marks)
Kindly be aware that this question shares the same context as Question 3, which focuses on the Facebook pages of 10 Australian fashion retail sellers. However, there have been some minor alterations made to the variables used in this particular question.
Located in Melbourne, Dataraft, is a customer strategy and analytics firm that has been tasked with conducting an in-depth analysis of the Facebook pages of ten Australian fashion retail sellers for a client. Your business analytics manager has specifically assigned you the responsibility for this project. The analysis focuses on posts of various types, including videos, photos, statuses, and links, to understand the nature of content shared by these sellers. Furthermore, engagement metrics such as comments, shares, and reactions are assessed to gauge the level of interaction and response from the audience. By exploring these factors, it aims to gain insights into the social media strategies employed by these Australian fashion retail sellers and their effectiveness in capturing the attention, engagement, and purchase realisation of Australian Facebook users. Below (Table 5.1) are the variables utilised in this analysis.
A classification tree was used to create a classifier for this data, with whether a customer has made a purchase (made_purchase) as the target variable and the rest of the variables as input variables (Figure 5.1).
The data was partitioned using a random seed to create separate training and validation sets. Additionally, a full-grown tree with a maximum of 5 levels was applied to the classification tree. Please utilise the Excel printouts provided below to respond to the following questions addressed by your business analyst manager.
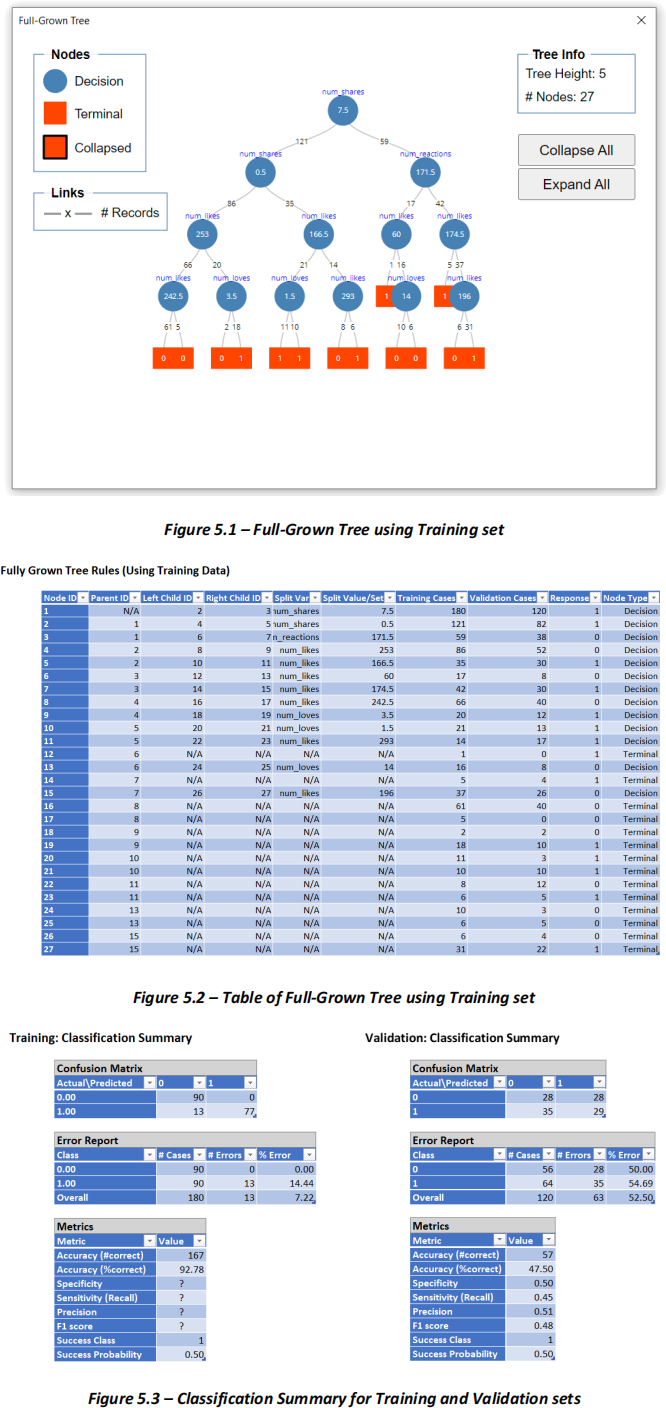
(i) How do managerial decision analysts partition datasets to develop effective classification algorithms? Please explain the datasets and provide two justifications for this approach. Additionally, could you identify any potential concerns or issues related to the given dataset/s in this problem and why? (5 marks)
(ii) Based on the Excel printouts provided earlier in the question, compute the classification errors for zero to three decision nodes on the training set. Arrange the decision nodes in a top-to-bottom, left-to-right order on the classification tree. Show your calculations and round your final answers to four decimal places. What observations can you make about these classification errors on the training set? (7 marks)
(iii) Based on the Excel printouts provided earlier in the question, calculate the Sensitivity, Specificity, Precision, and F1 score for the training set. Show your calculations and round your final answers to two decimal places. Then compare your answers with the same performance measures from the validation set. What are two possible explanations for the differences? (4 marks)
(iv) Base your answer on the Excel printouts provided earlier in the question. For a given Facebook post that utilised a status update (text only), which led to 255 likes, 23 loves, and 0 shares, determine the predicted outcome (classification) and identify the specific rule in the classification tree that leads to this prediction. (2 marks)
(v) Identify the least influential feature(s) with the least impact on the prediction outcome. Explain your answer. (2 marks)
2023-10-27