ST346: Assessed coursework 1
Hello, dear friend, you can consult us at any time if you have any questions, add WeChat: daixieit
ST346: Assessed coursework 1
Generalized Linear Models
Deadline 13:00 Tuesday 24 October 2023
Your solutions should be submitted electronically in the form of a PDF document using the submission portal on the ST346 Moodle page. Please remember to include only your ID number on your submission to allow anonymous marking.
You must show your working if you want credit for your answers. For most questions this will take the form of R code embedded in your document. You should also include a text explanation of what you are doing.
This assignment counts towards 10% of your final module mark. The maximum score for this coursework is 20/20. Numbers in brackets indicate the points available for each question. This assignment consists of three independent sections.
If you have any queries about the coursework please post them on the ST346 forum, but do not post any part of your solutions.
To access the data needed for this assignment, download the file CourseworkData1.rda from the ST346 Moodle web page and read it into R using the function load(). This will create 3 data frames in your workspace: mayflies, simdata1, and simdata2.
1 Mayflies
Mayflies are aquatic insects belonging to the order Ephemeroptera. They are extremely sensitive to pollution. The Wikipidia article on mayflies notes:
“In general, the larval stages of mayflies ... are susceptible to a number of pollutants including sewage, pesticides and industrial effluent ... The adverse effects on the insects of pollution may be either lethal or sub-lethal, in the latter case resulting in altered enzyme function, poor growth, changed behaviour or lack of reproductive success.”
“The threat to mayflies applies also to their eggs. "Modest levels" of pollution in rivers in England are sufficient to kill 80% of mayfly eggs, which are as vulnerable to pollutants as other life-cycle stages; numbers of the blue-winged olive mayfly (Baetis) have fallen dramatically, almost to none in some rivers. The major pollutants thought to be responsible are fine sediment and phosphate from agriculture and sewage.”
The mayflies data show the results of a survey of 30 river locations. The data frame contains two variables:
. CCU Heavy metal pollution index measured in Cumulative Criterion Units. Higher values mean more pollution
. Occupancy Binary indicator showing whether Mayflies were observed at the site (1=yes,0=no)
Fit a logistic regression model to the data with Occupancy as an outcome and CCU as a predictor
1.1 What is the probability of finding mayflies at a site with pollution level CCU=1.5? [1]
1.2 What is the percentage reduction in occupancy from CCU=1.0 to CCU=2.0? [2]
1.3 Reproduce figure 1 showing the Occupancy values plotted against CCU, and a smooth line showing the dose-response curve from the fitted model. You must show the resulting graph, not just the code to produce it.[2]
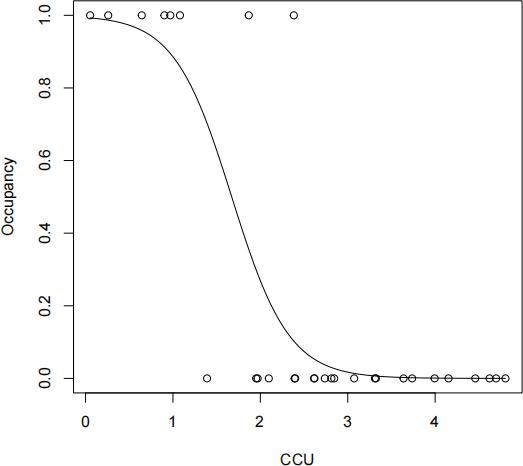
Figure 1: Dose-response curve for the mayflies data from a fitted logistic regression model.
1.4 Find the value of CCU that corresponds to the Occupancy falling below 10%. [2]
2 Simulations
Data frame simdata1 contains simulated data. There are two variables:
. x Predictor variable
. z Response variable such that
E(zi | xi) = α + βxi
Var(zi | xi) = ϕ
Data frame simdata2 contains data from the same simulations, except that z has been removed from the
data frame and replaced with
. y Binary indicator yi = 1{zi≥0} .
Fit a linear model to the data in simdata1 to estimate α and β .
2.1 Fit a model on the data in simdata2 with y as and outcome and x as a predictor that also produces estimates for α and β. Using appropriate diagnostic tools on the linear model to justify your choice, explain why the two models are compatible, with reference to the theory in Chapter 2. Show that the estimates of α,β are consistent between the two models within estimation error. [5]
3 Wordle
Note: the data for this section is not included in the file CourseworkData1.rda. To answer the questions, you must abstract the data from the description of the problem and put it in a suitable form for fitting a model inglm.
Wordle is an online game that became popular during COVID lockdown.1 It was eventually sold by its developer, Josh Wardle, to The New York Times for a seven-figure sum (i.e. somewhere in the range 1-9 million dollars, but rumoured to be around 3 million). You can try it yourself at https://www.nytimes . com/games/wordle/index.html.
The player has 6 attempts to guess the hidden 5-letter word. Each guess gives more clues in the form of colour-coded hints. See figure 2 for an example.
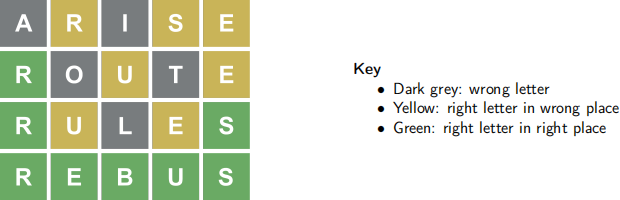
Figure 2: Example of a Wordle game solved in 4 guesses.
Figure 3 shows the scores for my last 25 attempts to play the game. The score is the number of guesses it took me to solve the puzzle. Lower scores are better.
Based on the empirical distribution shown in figure 3, I hypothesize that my Wordle score on day i is given by Score i = Yi+ 1, where
Yi ∼ Binom(µ,5)
Note that it takes at least one guess to solve Wordle, whereas the minimum value of the binomial distribution is zero.
3.1 Fit a binomial model to the data using the glm() function in R. Show how you fit the model using both ways to define the outcome variable in a binomial regression model and verify that they give the same answer. [2]
3.2 From your fitted model, calculate my expected score. Show that this is the same as the sample mean of my scores shown in figure 3 [1]
3.3 Does it matter which link function you use? Investigate and explain your findings. [2]
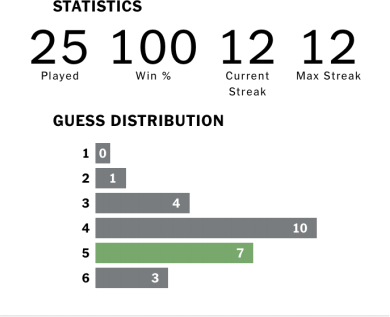
Figure 3: Scores for my last 25 attempts to play Wordle on my iPad. The bar corresponding to 5 is highlighted in green because my last game took 5 attempts.
3.4 Display a figure that compares graphically the observed distribution shown in figure 3 with the fitted distribution from your model. Is the binomial distribution a good fit to these data? Explain your findings. [3]
2023-10-21
Generalized Linear Models