ECON 216 Problem Set 1
Hello, dear friend, you can consult us at any time if you have any questions, add WeChat: daixieit
ECON 216 Problem Set 1
David Clingingsmith
23 September, 2023
Introduction
This problem set guides you through making some plots using the dataset on violent crime in US cities between 1975 and 2015 created by the Marshall Project. The ultimate source of the data used is the FBI Uniform Crime Report.
The problem set has three parts worth a total of 64 points. You will be graded based on the PDF output you create from your RMarkdown file.
Instructions
Make a project and an RMarkdown document
Go to your workspace on posit.cloud and create a new RStudio Project called PS1. Create a new RMarkdown document using the File > New File menu item in RStudio. Then save it into the project’s folder using the name abc123_ps1.Rmd, where abc123 is your CWRU ID.
Delete all the material in the new markdown document after the first code chunk.
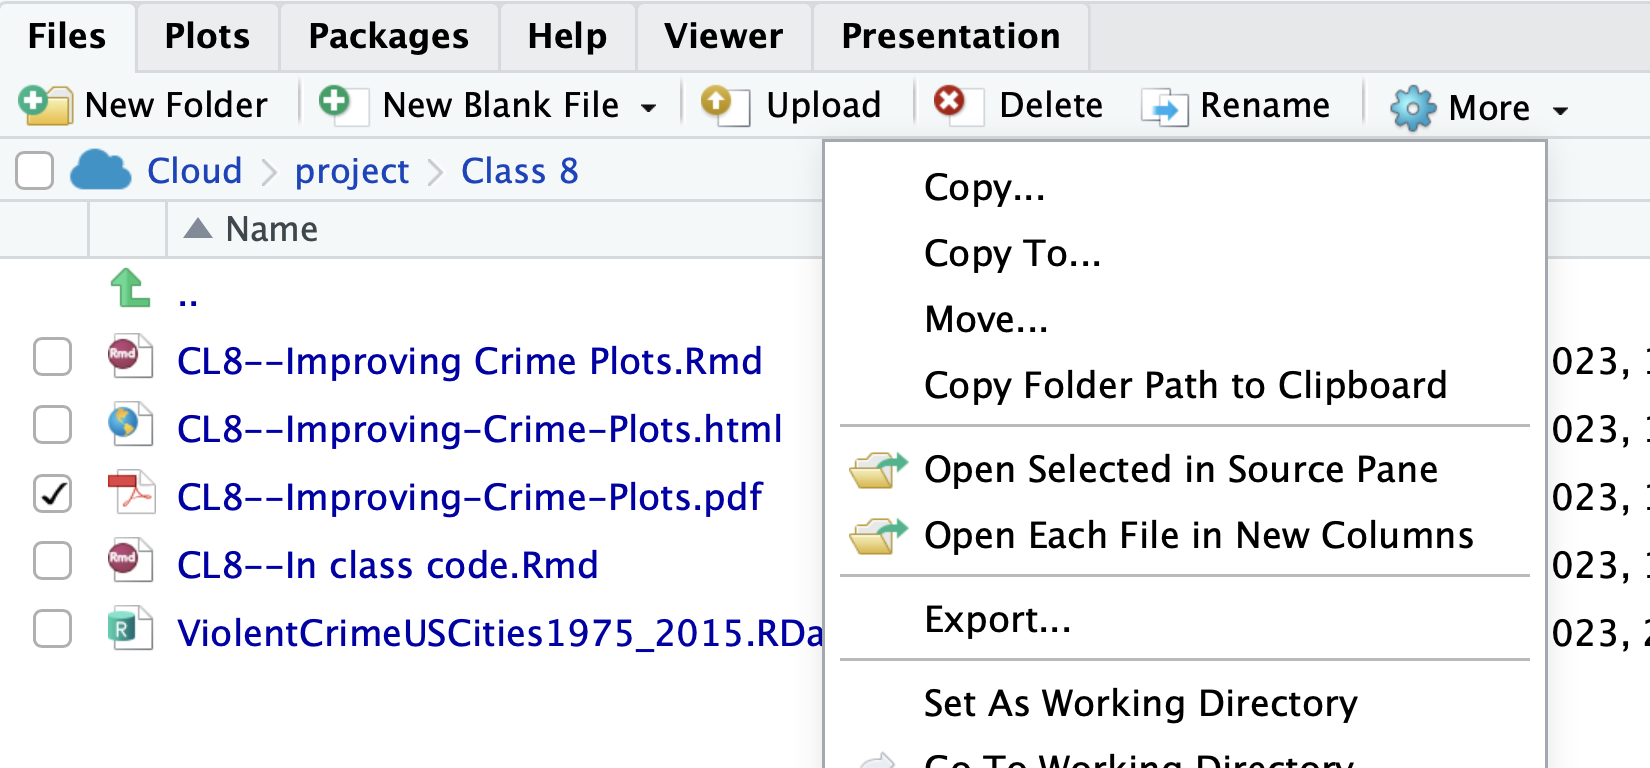
When you are done with the PS, you will submit the PDF knitted version of this document, which will be called abc123_ps1.pdf, in Canvas. You can export the file from Posit to your computer by selecting it in the file pane and using the “Export. . . ” command in the blue gear menu as shown.
Place the data in your project
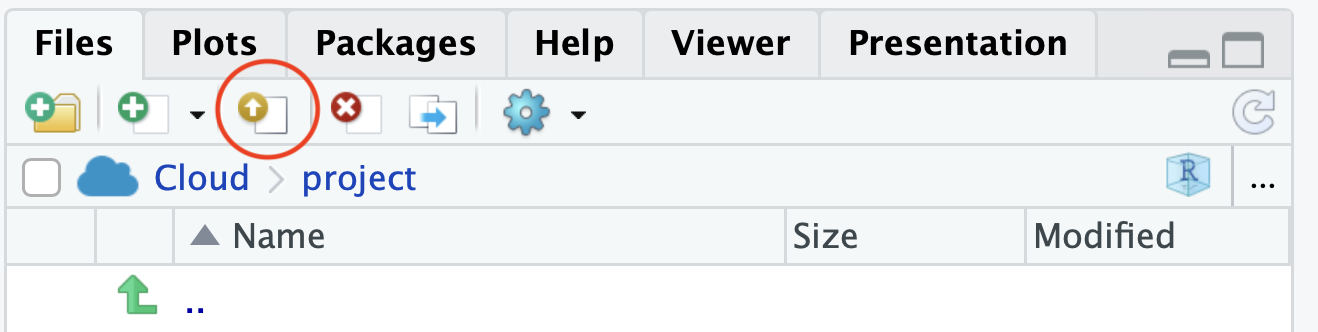
Upload the data file ViolentCrimeUSCities1975_2015_PS1.RData using the “Upload files” button in the Files pane in RStudio.
Labeling your document
Part 1 (24 points)
A. In your document, write a code chunk that loads the tidyverse and then the violent crimes data file. (2 points)
B. Write a code chunk that uses the glimpse and function to examine the data. What is the unit of observation of this dataset? (4 points)
C. Write a code chunk that uses a pipeline to create a dataset called assaults. The pipeline should use dplyr functions/verbs to modify assaults so that it 1) contains only the observations for which the variable crime_type is equal to “Assaults”, and 2) contains a new factor variable called city based the variable agency_jurisdiction. (8 points)
D. Describe in words the unit of observation of assaults. Glimpsing or viewing the data will help you. (4 points)
Part 2 (24 points)
A. Selects only the crime_type of “Homicides.” (3 points)
B. Creates a factor variable city based on agency_jurisdiction. (3 points)
C. Groups the data by city. (3 points)
D. Summarizes the data by creating a new variable tot_homicides that sums the total homicides per city over the 1975 to 2015 period. (5 points)
E. Arranges the city categories in the city variable in the order of the tot_homicides. You will need the functions mutate() and fct_reorder() to do this. Method 1 on this page will help you. (6 points)
F. What is the unit of observation of homicides_7515? What does tot_homicides measure? At what step in the pipeline does the unit of observation first differ from that of data? (You can answer the last question by running the pipeline step-by-step.) (4 points)
Part 3 (16 points)
Write a code chunk that uses homicides_7515 and the following steps to make a plot with ggplot:
A. Create a plot with tot_homicides on the x-axis and city on the y-axis. (8 points)
B. Add a function to create a column graph. (4 points)
C. Add a function to label the plot, including the axes and a title that describes what the plot shows. Use a caption to credit the creator and source of the data mentioned in the introduction. (4 points)
2023-09-30