ELEC270 SIGNALS AND SYSTEMS FIRST SEMESTER EXAMINATIONS 2021/22
Hello, dear friend, you can consult us at any time if you have any questions, add WeChat: daixieit
ELEC270
FIRST SEMESTER EXAMINATIONS 2021/22
SIGNALS AND SYSTEMS
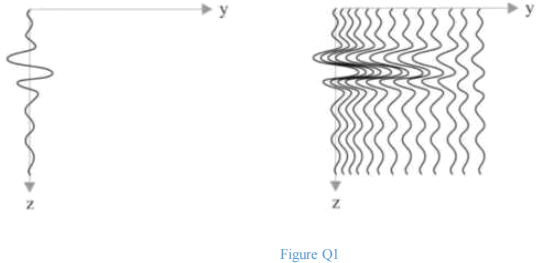
Q1. Ground Penetrating Radar (GPR) uses high frequency radio waves to visualise boundaries between
materials of different properties. Reflected pulses are received by an antenna, sampled, digitised and presented in the form of a 1-dimensional signal known as an A-scan, as shown in Figure Q1 below.
Multiple A-scans are then stacked together to produce a 2-dimentional visualisation known as a B-scan.
a) Sketch the spectrum of this A-scan.
b) Each A-scan is convolved with another signal to remove high frequency noise. Sketch this signal in the time and frequency domains.
c) Sketch the spectrum of the A-scan after filtering.
d) The energy in each A-scan is computed using an autocorrelator. Draw a block diagram of a system that would achieve this.
e) Explain how autocorrelation can be used to compute the energy of a signal.
Total 25
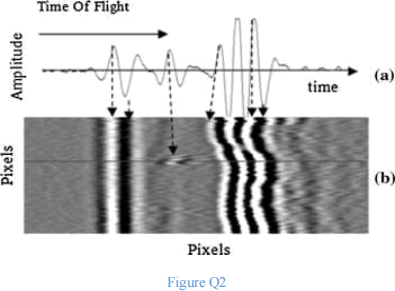
Q2. Time-of-Flight Diffraction (TOFD) is a form of ultrasonic measurement where transducers are moved
along the surface of a material to detect and visualise flaws and defects beneath the surface. Reflected pulses are received by a transducer, sampled, digitised and presented in the form of a 1-dimensional signal known as an A-scan, as shown in Figure Q2 below. Multiple A-scans are then stacked together to produce a 2-dimensional visualisation known as a B-scan.
a) How would you characterise this A-scan signal? Use the following properties: random, deterministic, continuous, discrete, periodic, non-periodic, energy, power, analogue, digital, causal and non-causal.
b) These A-scans are passed through a filter to remove unwanted low frequency components. Sketch the spectrum of one of these signals before and after filtering, commenting on the difference.
c) Show how autocorrelation can be used to compute the energy of a single A-scan.
d) Is the autocorrelation function referred to in (c) above even or odd? Explain your answer.
Total 25
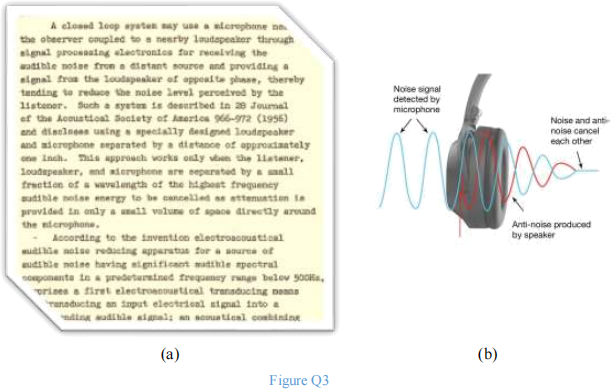
Q3. Noise-cancelling headphones utilise technology first proposed and patented by A G Bose in 1981; Figure Q3(a) shows an excerpt from this patent, while Figure Q3(b) shows a simplified, non-technical illustration of how noise cancellation works.
a) Consider the example of someone using noise-cancelling headphones to listen to a violin note v(t), corrupted by the addition of external noise n(t), approximated as given below:
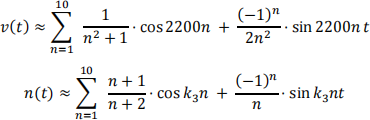
where k3 is given in the table on page 3.
i) Find an expression that can be used to calculate the power of the noise signal (you do not need to calculate the power).
ii) Find the anti-noise signal̂(n)(t) that would be used to cancel the noise signal.
iii) Find the fundamental frequency of the violin tone and calculate the Nyquist rate for this signal as approximated above. Give two reasons why music is not sampled at this rate.
b) Calculate and sketch the first 5 terms (C0 − C4) of the Fourier Series of v(t).
Total 25
Q4. a) Dual Tone Multi-Frequency (DTMF) represents the sounds or tones generated by touch
tone phones when the keys on the keypad are pressed. These sounds are used to control automated equipment and/or dial numbers. Each key has two equally loud tones at specific frequencies as shown in Table Q4a1.
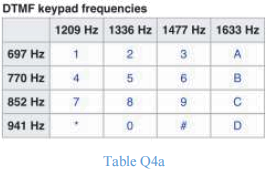
i) Sketch the spectrum of the signal generated by dialling the key “ r4 ” where r4 is given in the table on page 3.
ii) Calculate the fundamental period of the signal described in (a) above.
b) According to Benade2 the spectra of the signals representing certain vowel sounds can be represented as shown in Figure Q4b.
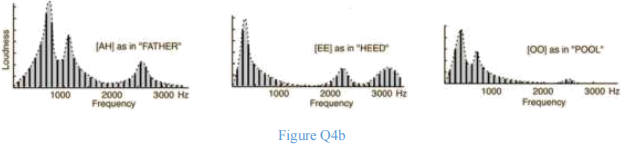
i) Estimate the fundamental frequency of the signal representing the sound “ooooo” .
ii) Design asystem capable of distinguishing between the sounds “aaaah” and “eeeee”.
Explain and justify your approach, using suitable illustrations as appropriate.
Total 25
Q5. a) Consider the system represented by the block diagram shown below:
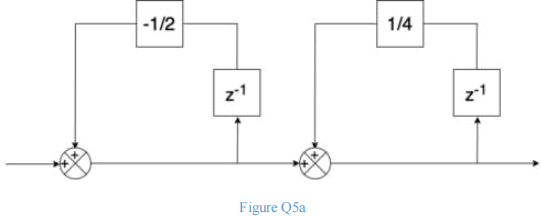
i) Find the transfer function of the above system.
ii) Find the output y[n] of the above system when subjected to an input x[n] = k5 ⋅ δ[n] where k5 is given in the table on page 3.
b) Consider another system with impulse response h[n] = βn ⋅ u[n] that is subjected to an input signal x[n] = an ⋅ u[n].
i) Find the output signal y[n] in terms of C and β.
ii) Sketchy[n] for the values of C and β given in the table on page 3, and comment on its final (eventual) value, if applicable.
Total 25
Q6. a) Consider the system represented by the block diagram shown below.
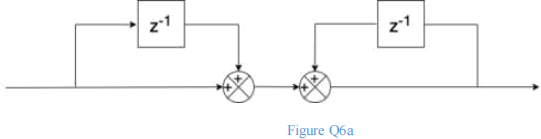
i) Find the transfer function of the above system.
ii) Find and sketch the output y[n] of the above system when subjected to an input x[n] = k6 ⋅ δ[n] where k6 is given in the table on page 3.
b) Consider another system with impulse response h[n] = a−n ⋅ u[−n] that is subjected to an input signal x[n] = an ⋅ u[n], where 0 < a < 1.
i) Find the output signal y[n] in terms of a.
ii) Sketchy[n] for the value of a given in the table on page 3, and comment on its final
(eventual) value, if applicable.
Total 25
Q7. When a linear time-invariant system is subjected to an input x(t) = δ(t) the output y(t) = e−k7⋅t ∙ u(t) where k7 is given in the table on page 3.
a) Find and sketch the system impulse response ℎ(t).
b) Find and sketch the system step response S (t).
c) Explain whether the system is causal and/or memoryless.
d) Find the response of the system to an input x(t) = e−2t ∙ u(t).
e) Find and sketch the transfer function H(S) of this system.
Total 25
|
8. |
a) |
A linear time-invariant system has a step response given by S(t) = k8 . t . e一t . u(t) where k8 is given in the table on page 3. i) Find the system impulse response h(t). ii) Explain whether the system is causal and/or memoryless. iii) Find the system ramp response. iv) Find the response of the system to an input x(t) = 2δ(t — 1) + u(t — 2) |
|
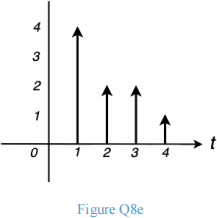
b) Another (different) LTI system has the impulse response shown in Figure Q8d.
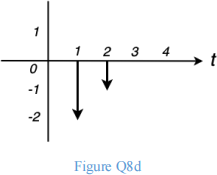
Find and sketch the input signal would produce the output shown below in Figure Q8e?
Total 25
2023-09-04