ECMT2130 – Tutorial 4
Hello, dear friend, you can consult us at any time if you have any questions, add WeChat: daixieit
ECMT2130 – Tutorial 4
Conceptual Questions
1) Is it possible to observe gains of diversification in a two-share portfolio if they have a positive correlation? Provide an example to support your answer.
2) What is the difference between the F curve (as defined in lectures) and the efficient frontier?
3) What is the global minimum variance portfolio?
4) What is theoretical value of the variance of a risk-free asset? What must be true about its covariance with any other asset?
5) In selecting the market portfolio, why do we pick the capital allocation line that touches the efficient frontier and at the sametime has the highest gradient? What is this line called?
6) What is the Sharpe ratio conceptually? What is its formula?
7) Explain the intuition behind the formula for the CAPM model.
8) Cite at least two usages for the CAPM.
9) What does the beta of the CAPM model measure? What does it mean if the beta is above 1?
10) What is the Securities Market Line (SML)? How does it differ to the Capital Market Line (CML)?
11) What is the alpha in the CAPM model? What does it measure? If alpha is smaller than
zero, what does this imply about the value of the asset? How can it help us determine if the CAPM model works well?
Numerical Questions
1) Jane has access to three different assets with expected returns and standard deviations displayed on the table below.
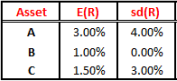
a) Which one of these assets can be viewed as the risk-free asset? Explain.
b) Jane is interested in constructing a risky portfolio (one that doesn’t contain the risk-free asset). Write the general formula for the expected return and standard deviation for this portfolio. Call the weight on one of the assets p and the other (1 − p).
c) Jane believes she should invest 70% of her money in the risky asset with the highest return and the remaining in the other one. Assuming the correlation between the returns of these risky assets is -0.4, calculate the expected return and standard deviation of her risky portfolio.
d) Sketch the F curve. Make sure to include Jane’s portfolio, the global minimum-variance portfolio, the risk-free asset and the two individual risky assets.
e) What are the weights of the global minimum-variance portfolio?
f) Is the global minimum-variance portfolio a better option than the risk-free asset?
g) Using the Sharpe ratio as a criterion, which one of the options Jane has so far would be the best? Remember she can choose (1) the first risky asset; (2) the second risky asset; (3) the risky portfolio she put together; or (4) the global minimum-variance portfolio.
h) Jane knows calculating the weights of the market portfolio would be hard to do by hand. So, she would be happy if you could describe to her what needs to be done (i.e., which equations to use and what manipulations are needed). Describe to Jane what this process would involve.
2) Mark tracked the return series of a risky portfolio for 5 periods. He also gathered data on market portfolio and risk-free returns, and compiled all the information on the table below (all values in %):
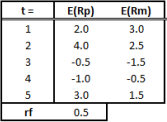
a) Using the OLS estimator, calculate the alpha and beta of the risky portfolio (Rp) using the CAPM model. Feel free to use a software (Excel orR) to conduct the calculations but I believe it would be best if you try doing this one by hand.
b) What does the estimate of beta suggest about the risk of the portfolio in relation to the risk of the market? What does the value of alpha suggest?
c) Mark calculated the 95% confidence interval (CI) around the estimated alpha to be (- 1.475, +2.525). Can we challenge the validity of the CAPM model? In other words, can we reject the null hypothesis that H0 : a = 0.
d) Out of curiosity, Mark calculates the 95% confidence interval for beta. He obtained (0.92, 0.98) as a result. Interpret this confidence interval and discuss what we can conclude about the risk of the risky portfolio.
e) Mark works with valuation of infrastructure projects, and he believes one of the projects has the beta equal to the one you obtained in (a). What is the expected return for the project in period 2?
Computational Questions
1) Use the spreadsheet I made available (Comp Exerc 1.xlsx) to verify your answers to the numerical question 1 (Jane’s situation). Replace the cells highlighted in green in the matrix of returns/risk to get Jane’s values. Also, take sometime to understand the formulas used.
Looking at the spreadsheet, can you tell – without calculations – which portfolio is closest to the market portfolio?
2) Use the spreadsheet I made available (Comp Exerc 2.xlsx) to calculate the alpha and beta for Woolworths shares using the premises of the CAPM model and the All Ordrs index as the market proxy.
2023-08-28