ECON 201 B (Summer 2023) Exam 1
Hello, dear friend, you can consult us at any time if you have any questions, add WeChat: daixieit
ECON 201 B (Summer 2023)
Exam 1
110 points total. 90 minutes maximum. Please write legibly and show your work onevery problem and label graphs. Use two decimal places of precision when necessary. Attempt all questions!
Please read the following statement from the Department of Economics:
Academic integrity is the cornerstone of the Department’s rules for student conduct and evaluation of student learning. Students accused of academic misconduct will be referred directly to the Office of Community Standards and Student Conduct for disciplinary action pursuant to the Student Conduct Code and, if found guilty, will be subject to sanctions. Sanctions range from a disciplinary warning to academic probation, to immediate dismissal for the Department and the University, depending on the seriousness of the misconduct. Dismissal can be, and has been, applied even for first offenses. Moreover, a grade of zero can be assigned by the instructor for the course.
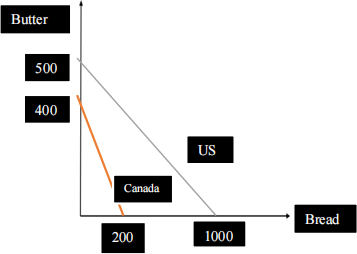
1. (20 points) Suppose that US and Canada produce bread and butter. There are 100 workers in US and 50 workers in Canada, who can each work up to 40 hours per week. It takes each US worker 4 hours to produce one loaf of bread or 8 hours to produce one pound of butter. For Canadian workers, it takes each worker 10 hours to produce one loaf of bread or 5 hours to produce one pound of butter.
a. (5 points) Depict graphically the weekly production possibilities frontier (PPF) of butter and bread for US and Canada.
b. (2 points) Who has a comparative advantage in producing bread and why?
OC of one loaf bread for US = ½ pound of butter
OC of one loaf of bread for Canada = 2 pounds of butter
OC of one pound of butter in US = 2 loaves of bread
OC of one pound of butter in Canada = ½ loaf of bread
½ < 2, so US has a comparative advantage in producing bread.
c. (2 points) In autarky, if US wants to consume 900 loaves of bread, how many pounds of butter can it consume?
To consume 1 loaf of bread, US must give up ½ pound of butter. So, to
consume 900 loaves of bread, US must give up 1/2*900 = 450 pounds of butter. It can therefore consume (500-450) = 50 pounds of butter.
d. (2 points) In autarky, if Canada wants to consume 200 pounds of butter, how many loaves of bread can it consume?
To consume 1 pound of butter, Canada must give up ½ loaf of bread. So, to consume 200 pounds of butter, US must give up 1/2*200 = 100 loaves of bread. It can therefore consume (200- 100) = 100 loaves of bread.
e. (9 points) Calculate the gains from trade if both countries specialize in the
production of the good in which they have comparative advantage. Hint: use a price (of one good in terms of another) that is mutually beneficial for both countries.
US specializes in bread, produces 1000 loaves. Canada produces 400 pounds of butter. Suppose the ‘no trade’ point is as in part c) and d) above, i.e. US is consuming 900 loaves of bread and 50 pounds of butter and Canada is
consuming 200 pounds of butter and 100 loaves of bread. Price of butter in
terms of bread for trade will be between the OC of butter in Canada (1/2 loaf of bread) and US (2 loaves of bread). Let’s assume this is 1 (it lies between ½ and 2). So, 1 pound of butter is traded for 1 loaf of bread. If US sells 100 loaves of bread to Canada and buys 100 pounds of butter in return, it has
900 loaves of bread and 100 pounds of butter. On the other hand, Canada will have 100 loaves of bread that it has bought from US, and (400- 100) = 300 pounds of butter. Gains from trade are 50 pounds of butter for US, 100 pounds of butter for Canada.
|
|
US |
Canada |
||
|
|
Bread |
Butter |
Bread |
Butter |
|
No trade |
900 |
50 |
100 |
200 |
|
After trade |
900 |
100 |
100 |
300 |
2. (15 points) The market for eggs in the US is a competitive market and is in equilibrium.
a. (5 points) Depict this market graphically.
Simply draw a market in equilibrium, with axes, curves and equilibrium labeled clearly.
b. (10 points) Suppose this market is opened to international trade (it was previously an autarky) and as a result, the domestic price of eggs falls. Give an example of a government intervention by the US that will offer trade protection in this case. Graphically depict the effect of this government intervention on consumer surplus, producer surplus and total surplus (label all areas).
This is a case of imports. The government intervention is either import tariff or import quota. See pages 25-26 of lecture 3 for graphical depiction.
3. (5 points) A country produces candy and wheat and is operating at a point that is feasible but not efficient. What is the opportunity cost of producing candy at such a point? What about the opportunity cost of wheat at the same point?
OC of both is zero. To produce more of one good, no amount of the other good needs to be given up.
4. (15 points) Explain whether each transaction reflects an increase or
decrease in 2023 US GDP, and which part of aggregate spending in the US in 2023 is affected.
a. (5 points) An American buys Irish coffee in Ireland in 2023.
Decreases GDP; import
b. (5 points) Boeing opens a new manufacturing plant in Seattle in 2023.
Increases GDP; I
c. (5 points) Ted, an American, buys 100 shares of Amazon stock in 2023.
Not included in GDP
5. (15 points) The market for loanable funds is currently in equilibrium, with zero capital inflows or capital outflows and zero government budget deficit.
a. (10 points) Suppose the government’stax revenue increases and its
expenditure decreases. Assuming everything else remains the same, depict the effect of this on the loanable funds market on the graph above. Clearly explain the reasons for your answer. (Show the effect on either curve(s),
equilibrium interest rate and quantity of loanable funds traded in the market.)
Government runs a budget surplus, so there is an increase in the supply of loanable funds (rightward shift). Interest rate falls, quantity of loanable funds traded increases.
b. (5 points) What effect will this have on the amount of lending for private investment and why? Show the change in the graph above.
i has fallen and quantity of loanable funds traded has increased as in part a. Since all borrowings are for private investment (government is not borrowing), private investment increases.
6. (10 points) Analyze the following statement: “GDP has increased by 5% from last year. This is a good indicator of economic well-being as it represents an average increase in incomes.”
Some questions to think about: is this real GDP, nominal GDP, real GDP per capita or nominal GDP per capita? Is GDP a good indicator of economic well-being?
7. (10 points) Consider the following information about a simple economy that produces tables, chairs, and chalk.
|
|
2022 |
2023 |
||
|
|
Price |
Quantity |
Price |
Quantity |
|
Table |
$10 |
400 |
$12 |
500 |
|
Chair |
$4 |
100 |
$7 |
100 |
|
Chalk |
$7 |
200 |
$10 |
300 |
a. (5 points) Using 2023 as the base year, find the GDP deflator for 2022 and 2023.
Nominal GDP 2022 = 10*400 + 4*100 + 7* 200 = $5800
Real GDP 2022 = 12*400 + 7*100 + 10* 200 = $7500
GDP deflator 2022 = (5800/7500) *100 = 77.33
GDP deflator 2023 = 100 (it is the base year)
b. (5 points) Using the GDP deflator calculated in part b above, calculate the rate of inflation from 2022 to 2023.
Inflation = (GDP deflator 2023 – GDP deflator 2022) *100 / GDP deflator 2022
= {(100 – 77.33) / 77.33} * 100
= 29.316%
8. (10 points) For the economy below, does the unemployment rate understate the true level of unemployment, overstate it, or neither? Why or why not? If yes, by how much?
|
Unemployed adults |
90 million |
|
Employed adults |
300 million |
|
Marginally attached workers |
10 million |
|
Working age population |
600 million |
|
Underemployed |
20 million |
Understates since there are marginally attached and underemployed workers. Unemployment rate = 100 * 90/(300+90) = 23.08%
True level of unemployment = 100 * (unemployed + marginally attached + underemployed) / (unemployed + marginally attached + employed) = 100 * 120/400 = 30%
9. (10 points) The table below shows data on nominal GDP (in millions of dollars), real GDP (in millions of 2012 dollars) and population for MacroLand. Prices consistently rose between 1940 to 2020.
|
Year |
Nominal GDP (millions of dollars) |
Real GDP (millions of 2012 dollars) |
Population |
|
1940 |
$500 |
$5,000 |
20,000 |
|
1960 |
$1,000 |
$6,000 |
50,000 |
|
1980 |
$2,000 |
$8,000 |
100,000 |
|
2000 |
$4,000 |
$10,000 |
120,000 |
|
2020 |
$20,000 |
$15,000 |
130,000 |
a. (5 points) Why is real GDP higher than nominal GDP for years 1940-2000, but not for 2020?
Base year is 2012. Prices have risen consistently since 1940, so real GDP calculated at 2012 prices is higher than nominal GDP calculated at 1940/1960/1980/2000 prices. For 2020, nominal GDP is calculated at 2020 prices, which are higher than 2012 prices.
b. (1 point) Calculate real GDP per capita for 1980.
Real GDP per capita for 1980 = $8000 million / 100,000 = $80,000 (2012 dollars)
c. (1 point) Calculate the rate of growth of real GDP from 1940 to 2020.
[(15000-5000)/5000 ]* 100 = 200%
d. (3 points) Suppose real GDP in 2040 (time travel!) is $30,000 (millions of 2012 dollars). What can you say about the annual growth rate of real GDP between 2020-2040?
Doubling time = 70/annual growth rate
Real GDP doubles between 2020 and 2040, so annual growth rate = 70/20 = 3.5%
2023-08-18