QUANTITATIVE METHODS – JUNE 2017 Section II
Hello, dear friend, you can consult us at any time if you have any questions, add WeChat: daixieit
QUANTITATIVE METHODS – JUNE 2017
Section II
Case Studies
Case Study 1
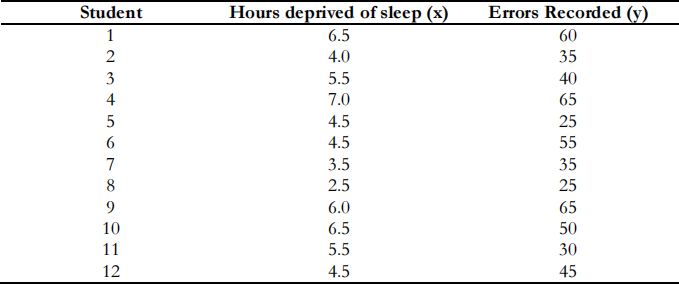
An experiment was carried out on undergraduate students to study the effects of sleep deprivation on their ability to solve problems. Each student was deprived of sleep for a certain number of hours in a particular week and the number of errors in solving a set of problems was recorded. The following data were collected for 12 students:

The following summary statistics have been calculated:

(i) Calculate the regression statistics and determine whether the relationship is significant. (14 marks)
(ii) What resultant error count would you expect for the following hours of sleep deprivation:
(a) 2 hours?
(b) 5 hours?
(c) 8 hours?
Justify your answers. (3 marks)
(iii) Write a report on the analysis of the data. Indicate any additional information you would require to complete a fuller analysis and include any recommendations for further analysis. (8 marks) (Total 25 marks)
Case Study 2
Transport Scotland, a government body, was investigating the speeds at which motorists are able to drive in Edinburgh and Glasgow city centres. Various news reports and recent surveys have implied that Edinburgh is a much less pleasant city to drive around, and drivers in the capital spend a lot of time sitting in traffic and waiting. Using automatic monitoring cameras, speeds of 200 cars were measured (in km/h) in Edinburgh: an average speed was found of 50 km/h with a standard deviation of 5 km/h. A similar sample of 200 cars in Glasgow had an average speed of 58 km/h with a standard deviation of 6 km/h.
(i) Determine whether the average speed of cars in Glasgow is significantly higher than in Edinburgh. Justify your findings. (12 marks)
(ii) Write a report on your findings. Discuss the relevance of the survey methodology. Indicate any further information you would require and any additional analyses you would wish to perform. (13 marks) (Total 25 marks)
Case Study 3
Edinburgh Airport has two runways that operate at different levels at different times of the day. The planning director for the airport is looking at utilisation levels of the two runways and has discovered that during the Monday morning peak period of 0700–0730, on average, there were three departures from Runway 1 and four departures from Runway 2.
(i) Calculate the probability that on a particular Monday between 0700 and 0730:
(a) There are four departures from Runway 1. (2 marks)
(b) There are more than four departures from Runway 1. (3 marks)
(c) There are no more than three departures from Runway 2. (5 marks)
(d) There are two departures from Runway 1 and two departures from Runway 2. (2 marks)
(e) There are at least four departures in total. (6 marks)
(ii) Describe the main characteristics of the distribution you have used above. (3 marks)
(iii) Explain the importance of this distribution to management decision-making and illustrate your answer with three examples of its use in business. (4 marks) (Total 25 marks)
Case Study 4
The planning director at Edinburgh Airport is looking at quarterly passenger data for the past three years and wishes to analyse the data and produce some forecasts for the next few quarters.
Quarterly data for Edinburgh Airport passenger numbers (millions), 2013–2016

(i) Briefly describe the main features of the data collected. (4 marks)
(ii) The manager wants to use the data to forecast future passenger numbers. Describe in detail how the method of decomposition analysis could be used to analyse the data and to forecast passenger numbers in each quarter for the next year. (17 marks)
(iii) Comment on the suitability of using decomposition analysis for these data. (4 marks) (Total 25 marks)
TOTAL OF 100 MARKS
2023-07-04