Spark on Jupyter
Hello, dear friend, you can consult us at any time if you have any questions, add WeChat: daixieit
Spark on Jupyter
Task Description
In this course work you will write several code snippets in Spark for an example dataset. You can test your queries on Jupyter Notebook. You should turn in your Jupyter Notebooks as A1.ipynb files along with A1.html and A1.pdf versions via Hub.
Data Description
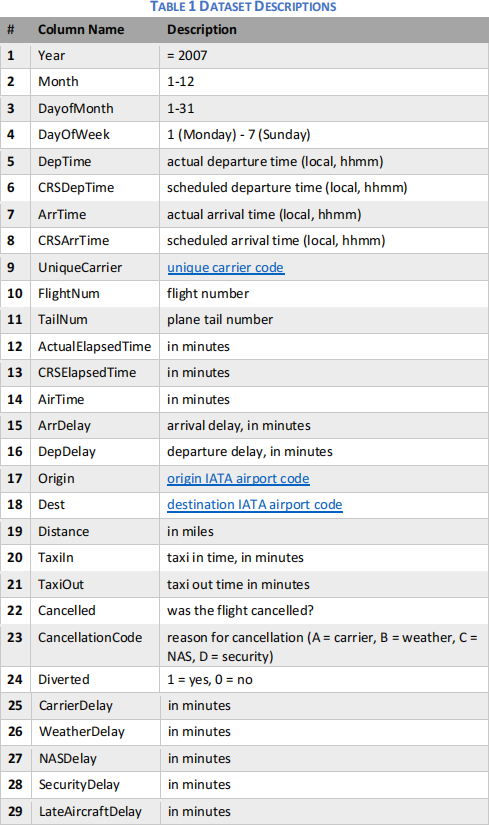
The dataset used is "Airline On-Time Statistics and Delay Causes" collected by U.S. Department of Transportation. The data will be stored at "/air_transit_2007.csv" once you set up the docker instance (see the example code below). Each row of the dataset contains 29 values, separated by comma. The dataset only contains flights operated in 2007.
Tasks
Here is a sample code to parse the CSV file and count the total number of flights departing from
Rochester, NY on 12 March 2007 (Greater Rochester International Airport, code=ROC):
|
# Initialize pyspark from pyspark import SparkContext sc = SparkContext .getOrCreate() # Initialize SparkSQL – Can only be used to format the output. from pyspark.sql import SQLContext sqlContext = SQLContext(sc) rows = sc.textFile("/air_transit_2007.csv") data = rows.map(lambda line: line.split(",")) sample_results = data.filter(lambda r: (r[16]=='ROC'and r[1]=='3' and r[2]=='12')) \ .map(lambda r: (r[5] , r[17])) \ .collect() #format nicely! sqlContext.createDataFrame(sample_results, ['Sched. Departure', 'Destination']).show(n=100) |
Write spark codes to fulfil the following tasks and print the result on the console. Print at most the first 100 results.
1) Compute the total number of records.
2) Find total number of operated flights per month, sorted by the month.
3) Find the plane with the highest number of flights. Each plane has a unique TailNum.
4) Compute the total flight time of each airplane, sorted by flight time in descending order.
5) Find the busiest airport (in terms of number of departures + arrivals of all operated flights) for each month.
6) Find the airline with highest average delay of each type in March 2007. Note: do not write separate code for each error type. You should compute a single RDD where each row contains the delay type, the airline that is worst regarding that delay type, and its average delay of that type in minutes.
7) Compute median, mean, and mode of columns 12-16, 19-21 and 25-29 for the flights in the third week of 2007. Exclude the non-numeric values.
8) Assume that a passenger wants to travel from Philadelphia International Airport (airport code:
PHL) to Los Angeles International Airport (airport code: LAX), and then go back to Philadelphia (PHL). He departs PHL not earlier than 5:59 am (scheduled time), stays at least 3:01 hours in Los Angeles and then arrive at PHL not later than 11pm. Based on the "scheduled" times, find which carrier has the highest number of flights with these constraints. Limit your analysis to February 2007 and use scheduled times.
9) Generate the `departure flights` board of the Los Angeles Airport at 12 Jan 2007 at 13:00. The board should contain flights with actual departure times between 12:00 and 14:00, sorted by scheduled departure time. The resulting table should at least contain scheduled departure time, actual departure time (if departed), airline code, and destination.
Notes:
• Please upload both the .ipynb , .html, and the PDF of your notebook.
• The output should be printed nicely. Do NOT simply print an array such as “[(u'MN', 17.2342347), (u'TK', 14.3823842)]” . Instead, print the resulting RDD such that somebody can easily read it.
• Briefly explain your code and each operation on the RDDs. If you make any assumption, please highlight it.
• You are NOT supposed to use SQL commands. However, you can use sqlcontext.dataframes to format the output after computing the results (see the example above).
• Take a look at all columns and try to understand the data. Make sure that you handle missing or incomplete values (e.g., NULL values). Also, use column(s) that are most accurate and meaningful for each task.
• The efficiency of your code is important. For example, you should filter out irrelevant data before computing a join.
2023-06-27